



High CPU usage seriously impacts Windows Server performance. It increases processing times for queued requests and reduces the number of new ones the server can accept. As load builds, the system slows down and can become unresponsive. CPU usage spikes can result from a single cause or a combination of factors.
This article covers how to troubleshoot high CPU usage. After reading the article, you will know how to:
- Monitor server CPU usage
- Identify the source
- Troubleshoot processes
- Resolve issues
Note: For Linux users, see How to Monitor CPU Spikes on Kamatera, How to Get Your Server Back Online, and 6 Quick Tools to Monitor System Resources on Linux.
Monitoring CPU usage on the Kamatera console
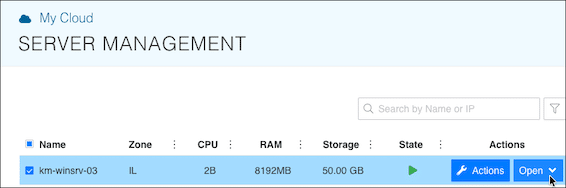
Kamatera lets you monitor your Windows Server instance’s CPU and other useful information directly from your Server Management page. Choose a server and click Open.
Note: The Web Console statistics show the CPU usage reported for the VM. However, Windows uses and reserves memory for the OS and other system functions, so the value shown in the console should not necessarily be interpreted as the amount of memory currently available to applications inside the server.
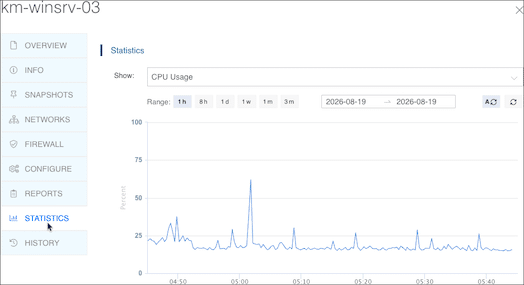
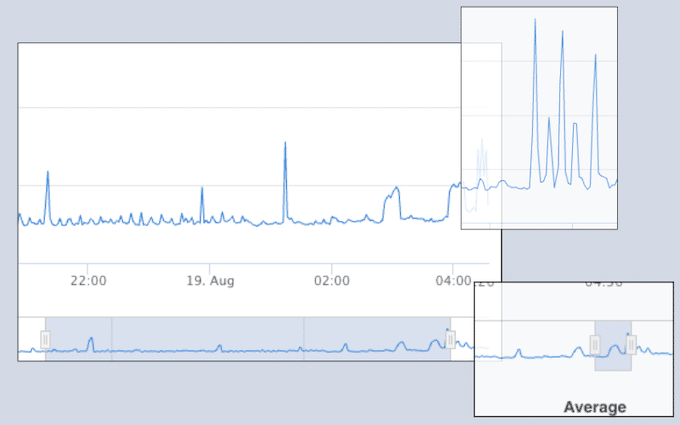
From the sidebar, choose Statistics. CPU Usage is displayed by default.
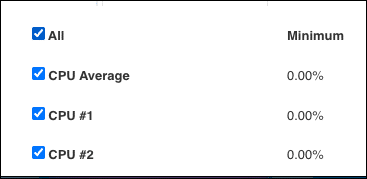
For servers with multiple CPUs, the graph averages CPU performance across all cores. To view performance for a specific CPU, use the checklist below the graph.
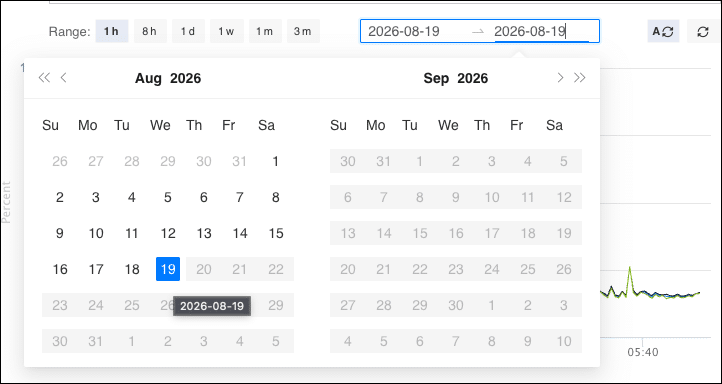
The graph offers several range options, from one hour to three months, plus a custom range that lets you set a start and end date.
For greater resolution, use the start and end sliders to isolate and zoom in on a specific area of the graph.
Locating problems on the server
Kamatera’s server statistics show you that a server’s CPU usage is high, but not where the problem is or what’s causing it. Finding the source means working directly on the server itself.
You can trace and isolate high CPU usage to a single task/process. A process is the lowest-level component running on Windows. Processes are compiled executable (.exe) files with a unique process ID (PID). It also provides access to system resources, such as CPU, memory, disk space, and networking. Each process manages one or more threads. A thread is a series of CPU instructions. Windows manages the CPU time allocated to each thread. Processes can launch child processes, each with their own threads.
Let’s start by opening the Kamatera console or launching a local RDP session.
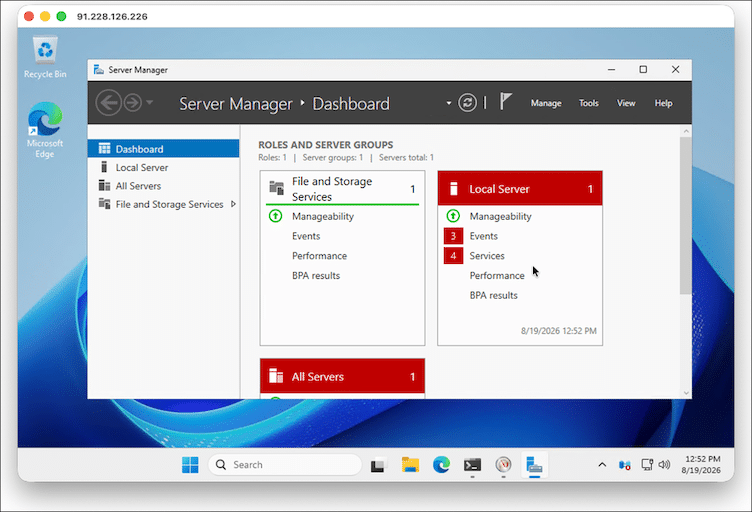
Monitoring processes: Task Manager
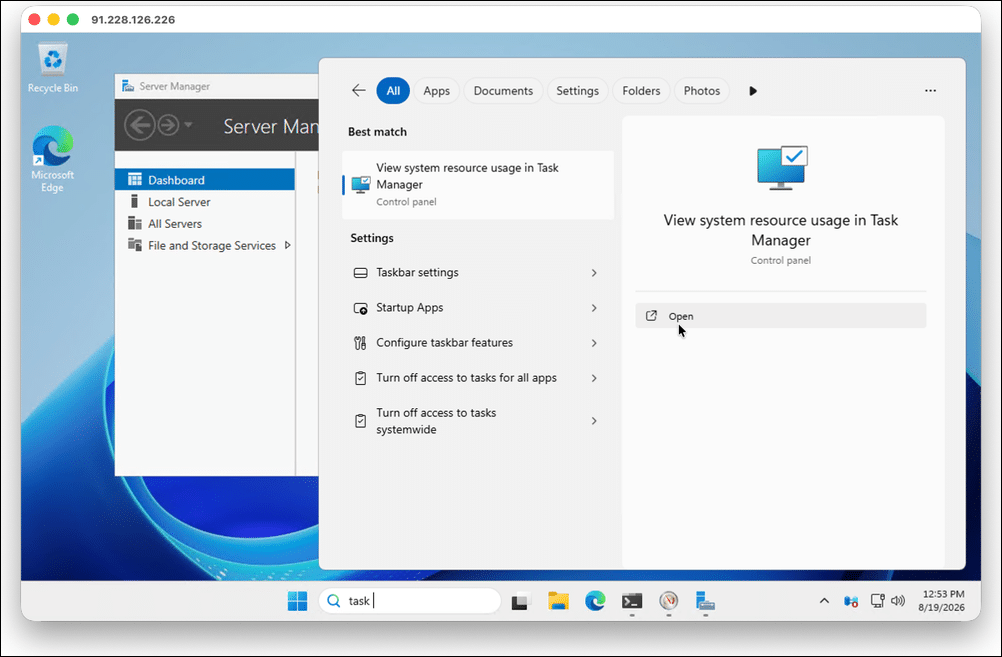
Windows Task Manager is a simple and comprehensive monitoring tool that lets you isolate that process. In the Start Bar’s Search box, click Open.
Click CPU in the top row to sort processes by CPU usage. Identify any processes with CPU usage greater than 80%.
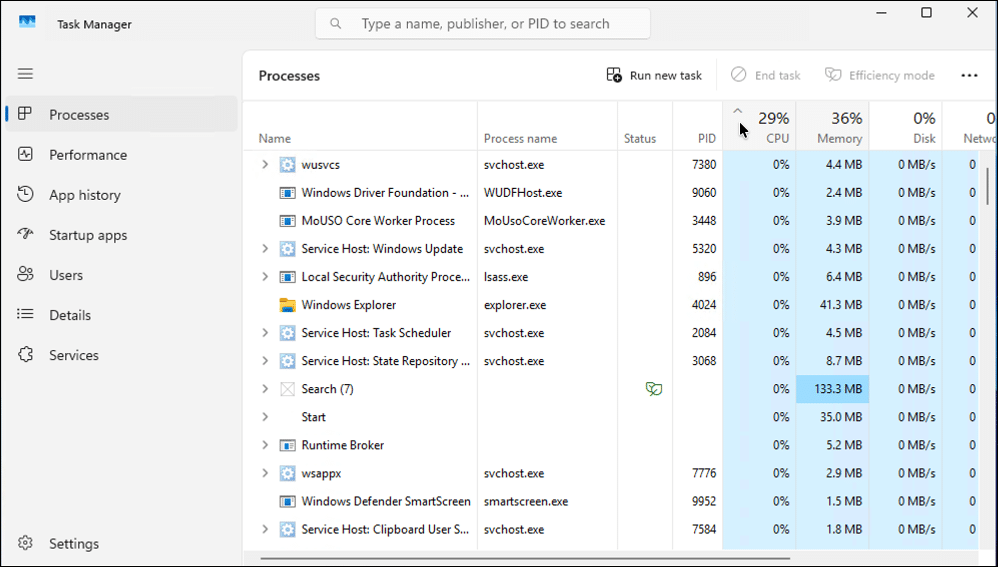
Note: Many of the processes seem to have mismatched names and process names. The names are different, but the process names are all the same. These are generic Service Host processes (svchost.exe). Svchost.exe enables Windows and Windows applications to read and execute code from dynamic-link libraries (DLLs).
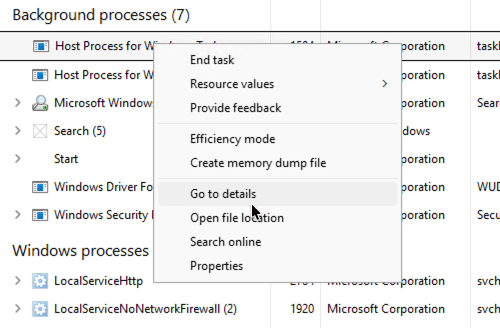
To display in-depth process information, right-click on a process. From the menu, choose Go to Details.
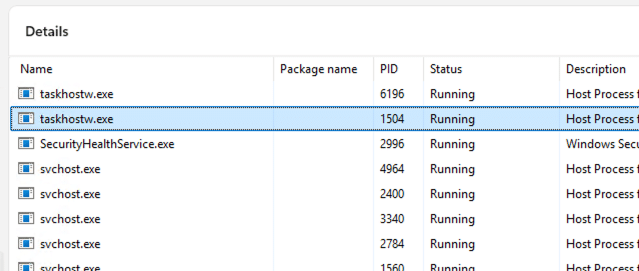
Details view shows each running process individually, rather than grouped by application, and lets you add or remove columns to display additional information.
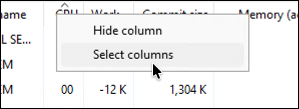
To add a column, click the top row and choose Select columns:
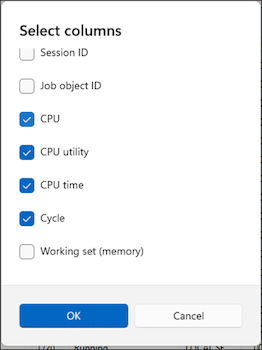
From the list, check and/or uncheck the columns you want to display.
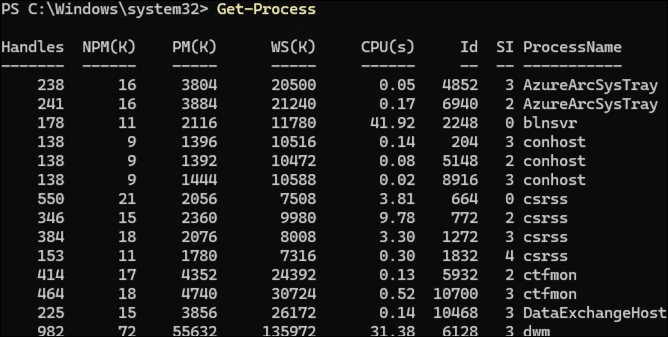
You can also locate processes with high CPU consumption with PowerShell. Open PowerShell and type:
Get-Process
The CPU(s) column displays, in seconds, the total CPU time a process consumes. This displays the following information for all running processes:
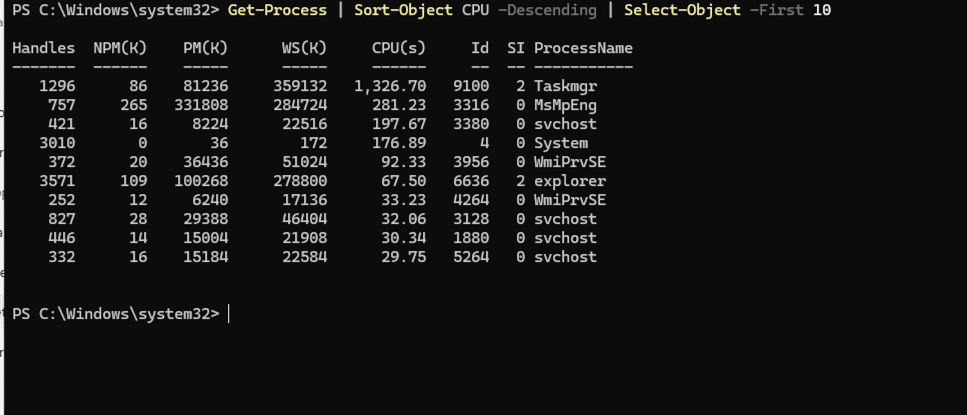
To make it easier to find the process with the heaviest CPU usage, use this command to find the top ten processes by CPU usage, sorted in descending order:
Get-Process | Sort-Object CPU -Descending | Select-Object -First 10
Troubleshooting processes
Windows Task Manager and PowerShell’s Get-Process command indicate processes with high CPU usage. Now, we need to determine whether this is a temporary spike or a persistent long-term system-level issue. Long-term issues fall into two categories: usage and bottlenecks.
Usage issues occur when the CPU performs processor-intensive tasks, such as backups, database requests, or operating system updates. These often occur between 80% and 85% and may indicate a temporary spike. Bottlenecks result from insufficient CPU capacity for the current workload, delaying execution of queued tasks. These occur at 85% or higher.
Windows Performance Monitor lets you build graphs of specific system resource counters, track them over longer periods, and store the information. This table displays the CPU counters it can track, what they mean, and the values that indicate potential or actual problems.
| Group | Counter | Meaning | Metrics | Investigate |
|---|---|---|---|---|
| Processor | % Processor Time | Total CPU usage that shows how busy the CPU is | 0-50%: healthy
50-80%: warning 80-100%: critical |
Workload/capacity |
| % User Time | CPU spent executing user-mode/application code | Applications and scripts | ||
| % Privileged Time | CPU spent executing kernel-mode code | Windows processes and services | ||
| % Interrupt Time | When a device needs immediate CPU attention. | High: 30%
Very high: 50% |
Device drivers or hardware | |
| % DPC Time | Deferred Procedure Call (DPC) Time: lower-priority processing tasks deferred by interrupt handlers performing urgent work first | Greater than 15% indicates a problem | ||
| Process | % Processor Time | Which processes are consuming CPU | Greater than 85% indicates a problem | Process threads |
| System | Processor Queue Length | Whether threads are waiting for CPU | Two or more instances per processor indicates high CPU usage | Workload/capacity |
To use Performance Monitor:
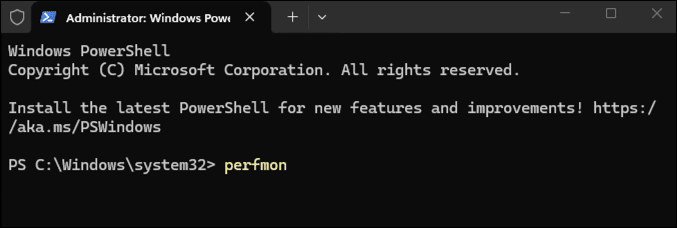
- Open a terminal and type perfmon.
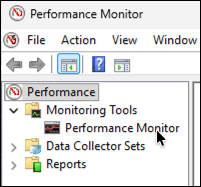
In the console tree, expand Monitoring Tools and click Performance Monitor.
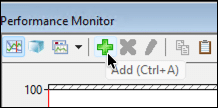
In Performance Monitor, click the + icon.
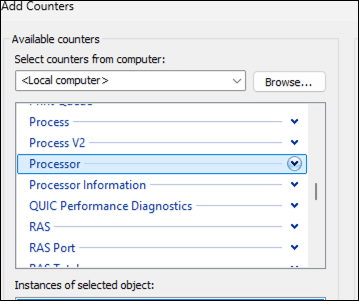
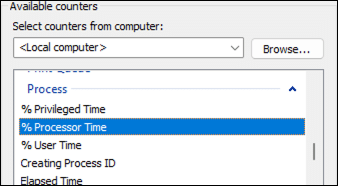
From Available Counters, choose Processor.
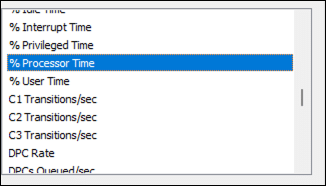
From the list, choose % Processor Time.
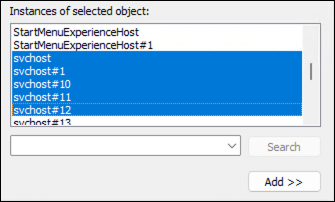
From Instances of selected object, select all the options.
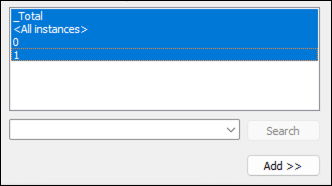
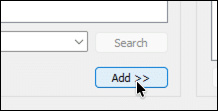
Click Add.
 From Available Counters, choose Process > % Processor Time.
From Instances of selected object, select all the processes you want to monitor.
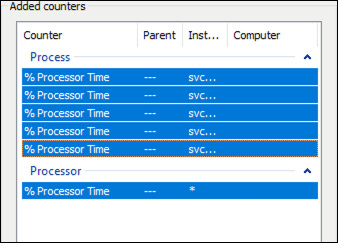
In the Added counters list, check that all the selected counters are displayed.
Click OK to close the dialog and save the changes.
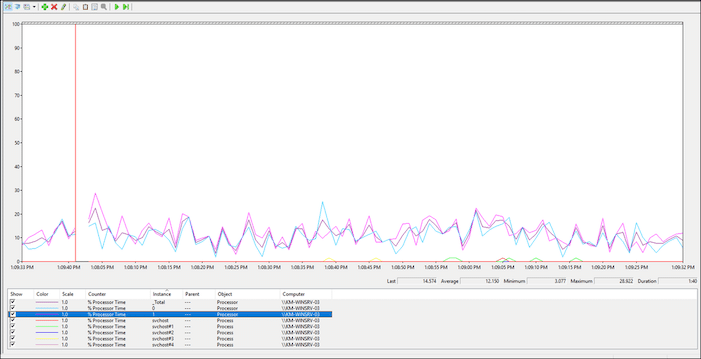
In the graph, monitor the selected counters.
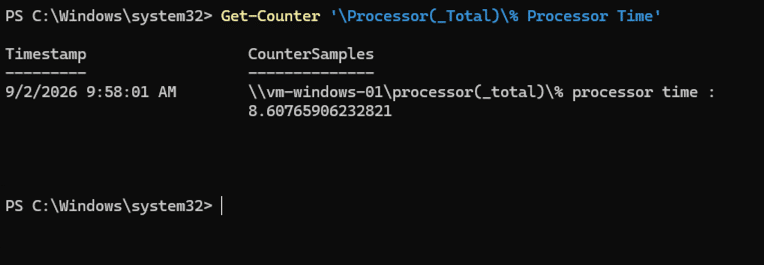
You can also display CPU counters with PowerShell’s Get-Counter command. For example, to show the processor’s total CPU usage:
Get-Counter '\Processor(_Total)\% Processor Time'
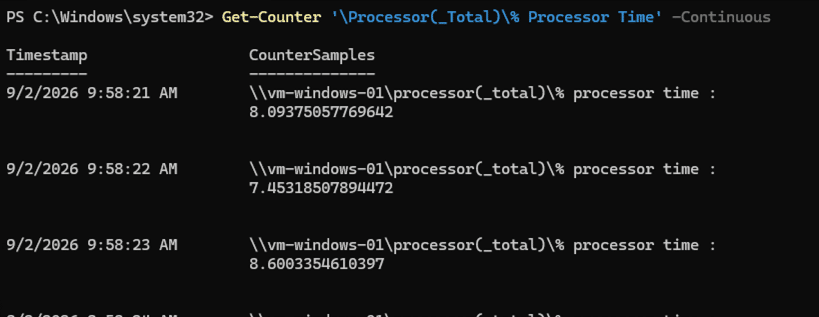
To show a continuously updating value, add the -Continuous flag
Get-Counter '\Processor(_Total)\% Processor Time' -Continuous
For multiple counters, use:
Get-Counter '\Processor(_Total)\% Processor Time','\Processor(_Total)\% User Time','\Processor(_Total)\% Privileged Time','\Processor(_Total)\% Interrupt Time','\Processor(_Total)\% DPC Time' -Continuous
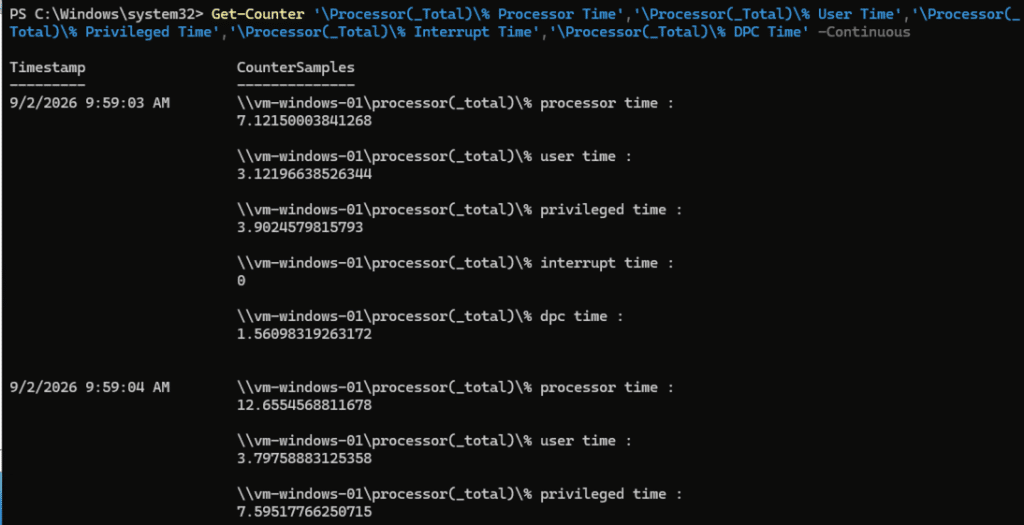
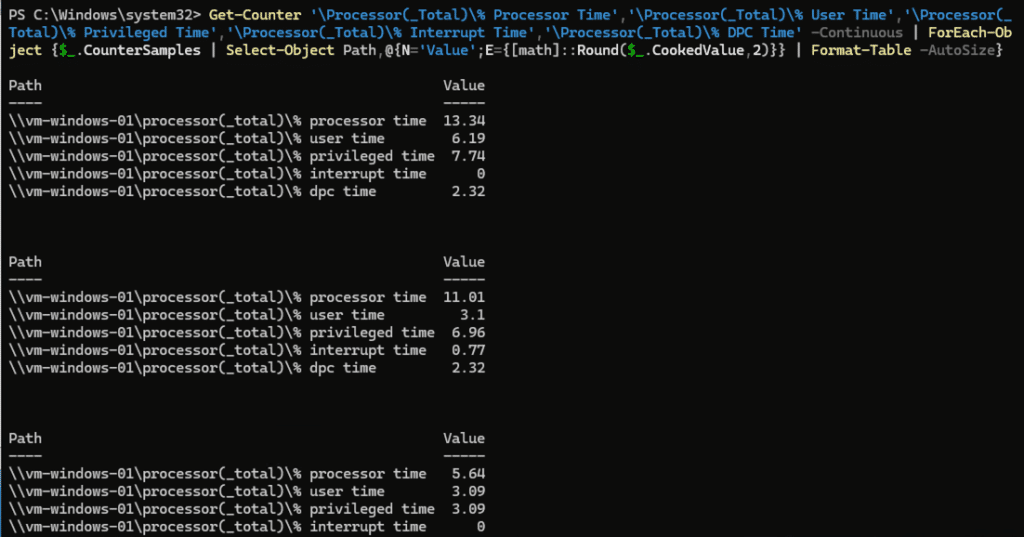
To organize this information in a table, use:
Get-Counter '\Processor(_Total)\% Processor Time','\Processor(_Total)\% User Time','\Processor(_Total)\% Privileged Time','\Processor(_Total)\% Interrupt Time','\Processor(_Total)\% DPC Time' -Continuous | ForEach-Object {$_.CounterSamples | Select-Object Path,@{N='Value';E={[math]::Round($_.CookedValue,2)}} | Format-Table -AutoSize}
Resolving issues
Now that we have the relevant information, let’s look at how we can fix these problems.
| Issue | Source | Resolution |
| Performance Counter: % Processor Time | Application process (sqlservr.exe, java.exe), Windows service, or generic Service Host (svchost.exe) | Upgrade, patch, or uninstall the application. Alternatively, in Task Manager, right-click the process and set the service’s priority to a lower level.
|
| Performance Counter: % User Time | Inefficient code, excessive requests, expensive database queries, compression/encryption, scripts, heavy workloads | Investigate whether the cause is internal or external. If it’s internal (e.g., proprietary code or scripts), file a bug report and install the fixed version. Similarly, for heavy workloads, find the source and ask them to reduce their specific workloads. |
| Performance Counter: % Privileged Time | OS/kernel activity, device drivers, heavy I/O/system-call activity, security software, malware | Identify the specific component, replace hardware, update drivers, and upgrade the OS. If you detect malware, install security patches, upgrade software to the latest version, or remove the component. |
| Performance Counter: % Interrupt Time / % DPC Time | Hardware and associated drivers | Find the specific component, replace hardware, update drivers, or upgrade OS. |
| Performance Counter: Processor Queue Length | Processor workload, high process thread count | Reduce CPU workloads, upgrade server, install more CPUs |
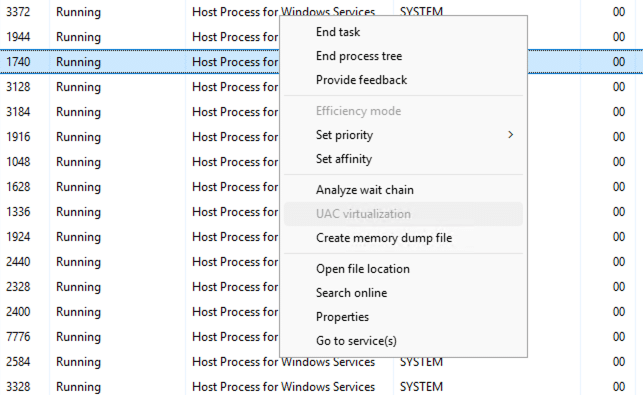
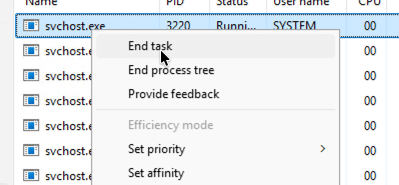
Note: Before you end a task or stop a service, check the possible impact of your action. If Windows or other important processes use the process or service, you could cause them to fail.
Conclusion: Getting the most from your CPUs
High CPU usage seriously impacts Windows Server performance, but as we explained, it’s also straightforward to find and fix. We covered how high CPU usage degrades server performance and how svchost process instances are one of the most common causes. We also showed you the tools Kamatera, Windows Server, and PowerShell provide to monitor and troubleshoot CPU resource problems. Use this knowledge to keep your own systems running smoothly.