Proactive monitoring is crucial for preventing performance bottlenecks and system failures in Linux environments. Understanding real-time resource usage provides invaluable insights for system administrators and developers. This document outlines six indispensable command-line tools that offer quick, real-time insights into your system’s health, enabling effective troubleshooting and optimization.
Why monitor Linux system resources?
Monitoring Linux system resources is a fundamental practice for maintaining healthy and efficient operations. It allows administrators to rapidly identify bottlenecks in CPU, memory, disk I/O, and network usage before they escalate into critical issues. Regular monitoring helps diagnose the root causes of application performance problems and system crashes, providing the data needed for effective resolution.
Furthermore, understanding resource utilization enables optimization of system configurations, leading to improved efficiency and stability. This proactive approach prevents costly downtime, ensures continuous service availability, and contributes significantly to the overall reliability of your infrastructure. It’s about preventing problems, not just fixing them.
6 tools to monitor system resources on Linux
Monitoring system performance on Linux is essential for keeping your servers and desktops optimized. This article highlights six fast and efficient Linux command-line tools to monitor CPU usage, memory consumption, disk I/O, and network traffic. Whether you’re managing cloud infrastructure or troubleshooting a personal machine, these Linux performance monitoring tools will help you stay in control.
1. top: Real-time resource monitor
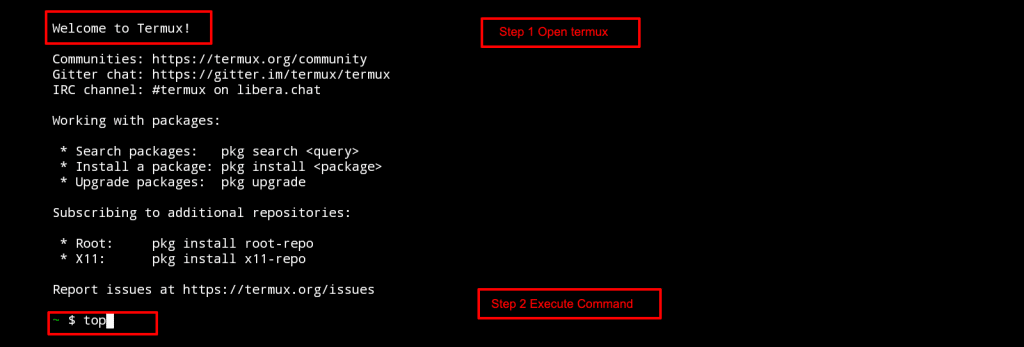
top is an interactive, real-time command-line tool that provides a dynamic view of running processes. It displays crucial system information such as CPU load averages (for the past 1, 5, and 15 minutes), total physical memory, available memory, and swap space utilization. The lower section of top lists individual processes, showing their Process ID (PID), user, CPU usage percentage, memory usage percentage, and the command that initiated them. Users can sort processes by CPU or memory usage and even send signals (like `kill`) to processes directly from the interface by pressing k.
Use: View live CPU, memory, and process usage.
Command: top
Tip: Press ‘q’ to quit. Use ‘Shift + P’ to sort by CPU.

2. htop: Interactive process viewer
htop is a more user-friendly and visually appealing alternative to top. It offers similar functionality but with enhancements like graphical CPU and memory usage bars, easier navigation (using arrow keys and mouse clicks), and the ability to scroll horizontally and vertically through process lists. htop provides a more intuitive way to manage processes, making it a favorite for many
Use: An improved, colorful version of top with mouse support.
Command: htop (Install via sudo apt install htop)
Tip: Use arrow keys to navigate and F9 to kill processes.


3. vmstat: Virtual memory statistics
vmstat: Virtual memory and system activity.
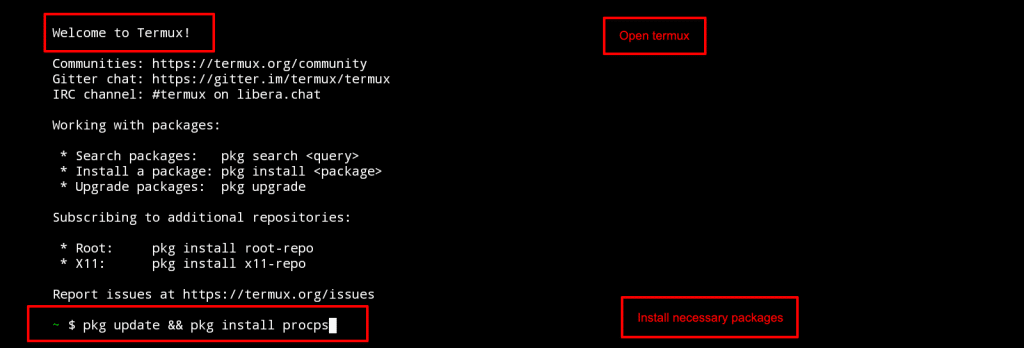
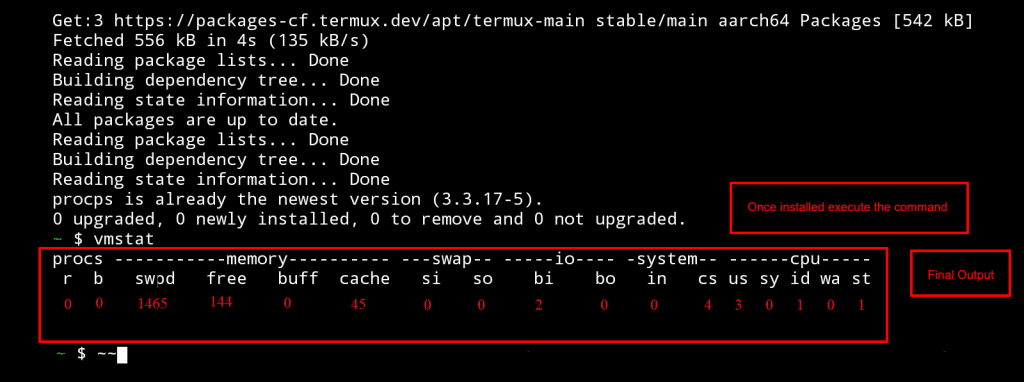
vmstat 1 provides a continuous stream of virtual memory statistics and system activity, refreshing every second. It reports on CPU usage, memory allocation, swap activity, disk I/O, and system calls. This tool is invaluable for detecting memory leaks, understanding the impact of high I/O operations, or identifying situations where the system is heavily reliant on swap space, which usually indicates insufficient physical RAM for current workloads.
Use: Check memory, swap, I/O, and CPU performance.
Command: vmstat 2 (updates every 2 sec)
Tip: Great for identifying performance bottlenecks.
4. iostat: Disk I/O monitoring
iostat is a powerful utility used for monitoring system input/output device loading, providing insights into disk activity and CPU utilization. Running iostat -x 1 delivers continuous reports, updated every second, that include extended statistics. These metrics are critical for identifying I/O bottlenecks that can severely impact application performance.
Use: Monitor disk throughput and CPU usage.
Command: iostat -xz 1 (Install with sudo apt install sysstat)
Tip: Use the -xz flags for extended stats and easier reading.
5. free: Memory usage snapshot
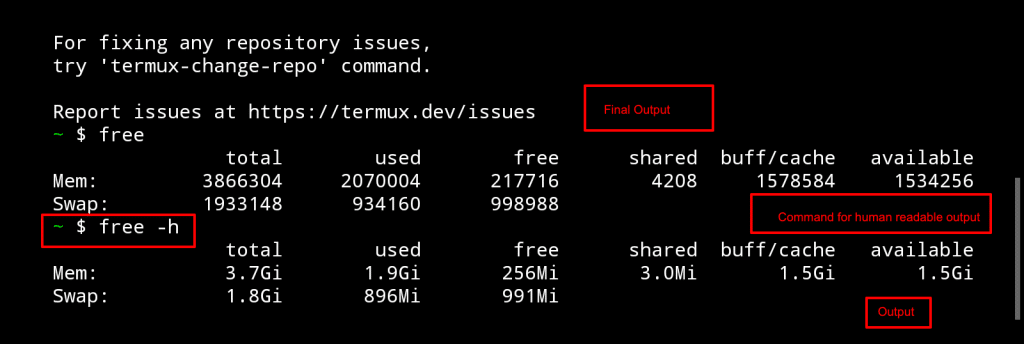
The free command provides a quick and concise summary of your system’s memory usage. Using free -h displays the output in a human-readable format (e.g., MB, GB), making it easy to interpret the total, used, and free amounts.
A key aspect of free‘s output is its differentiation between ‘free’ memory and ‘available’ memory. While ‘free’ indicates memory that is completely unused, ‘available’ memory accounts for memory that can be quickly reclaimed by the system.
Use: Quickly check RAM and swap status.
Command: free -h
Tip: Use -h for human-readable format.

6. nload: Network traffic visualizer
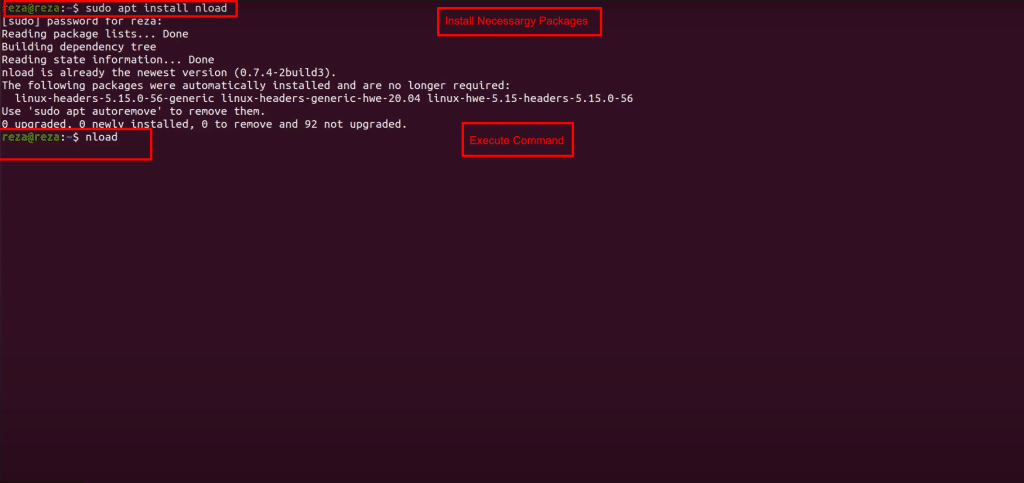
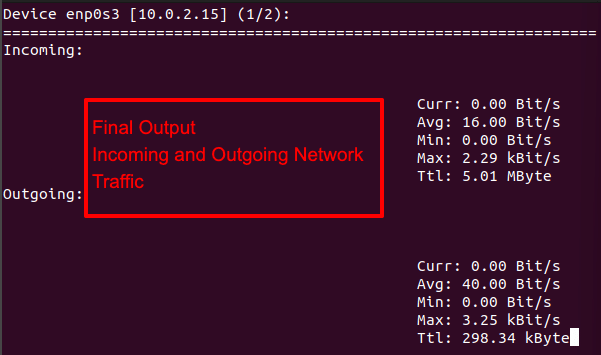
nload displays real-time incoming and outgoing traffic through graphs and also provides information like the total amount of data transferred. It displays the data in two graphs, where one is for incoming and there other is for outgoing traffic.
Use: Live incoming/outgoing bandwidth graphs.
Command: nload (Install with sudo apt install nload)
Tip: Switch between interfaces using arrow keys.
Final thoughts
These Linux monitoring tools are indispensable for any system administrator or developer. From lightweight utilities to real-time performance tracking, they ensure smooth operations and better resource allocation. Use them to enhance your Linux server monitoring strategy and optimize system performance.
