



A Windows Server running low on available memory shows up fast: sluggish response times, application timeouts, alerts from your monitoring tools, or users reporting that a service “feels slow” for no obvious reason. High memory usage can come from a range of causes, including memory leaks, misconfigured databases, too many active remote sessions, or malware.
When available RAM runs low, Windows starts paging, moving data from fast RAM to much slower disk storage. This keeps the system running, but at a cost: paging adds latency to every operation that touches paged-out data, and sustained heavy paging puts extra wear on the underlying drive. On a server under load, this can turn a memory problem into a performance problem that’s visible to every user hitting that server.
This article covers three ways to detect and resolve high memory usage: monitoring at the platform level, built-in Windows tools, and PowerShell for faster diagnostics.
For Linux users, see How to Monitor CPU Spikes on Kamatera, How to Get Your Server Back Online, and 6 Quick Tools to Monitor System Resources on Linux.
Check memory usage from the Kamatera dashboard
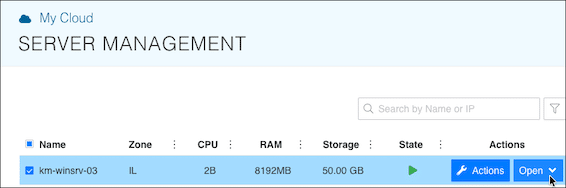
Kamatera lets you monitor your Windows Server instance’s Memory and other useful information directly from your Server Management page. Choose a server and press Open.
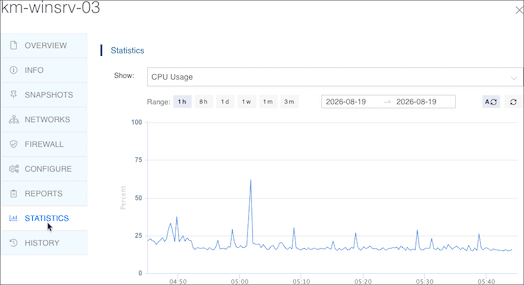
From the sidebar, choose STATISTICS.
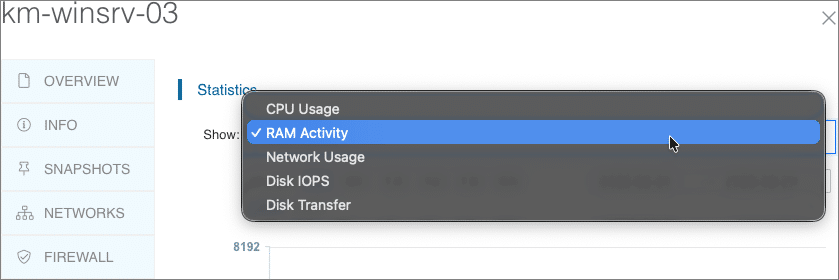
From the list, choose RAM Activity.
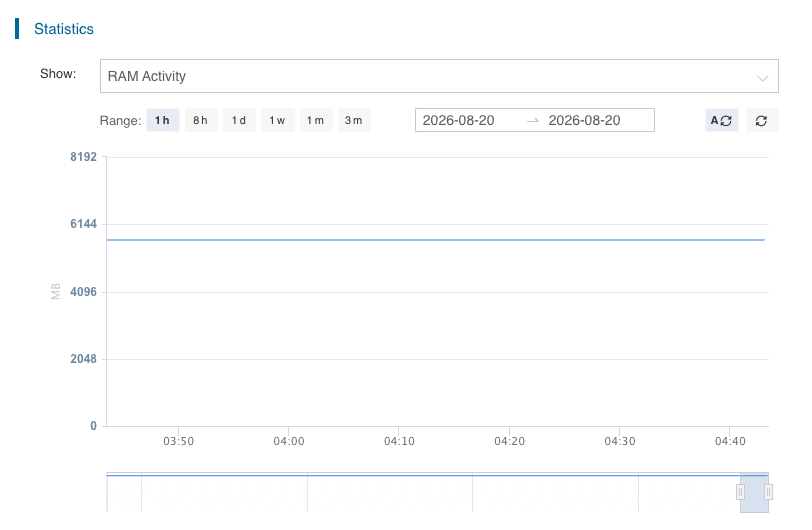
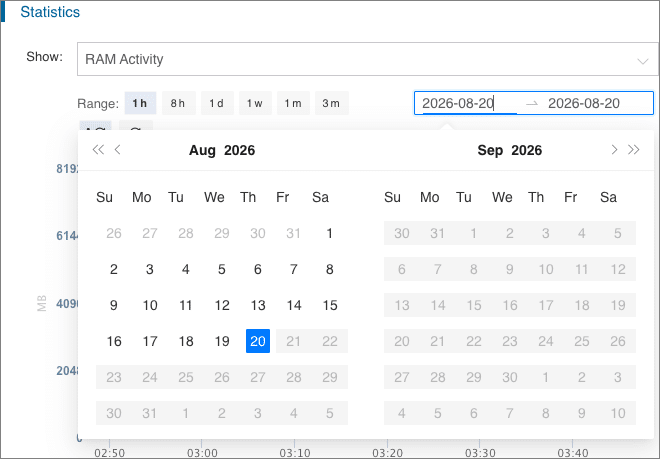
The graph offers several range options, from one hour to three months, plus a custom range that lets you set a start and end date.
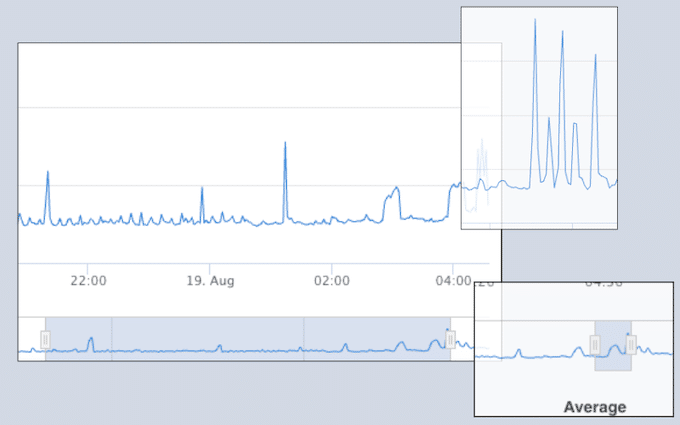
For greater resolution, use the start and end sliders to isolate and zoom in on a specific area of the graph.
Monitoring high memory usage on the server
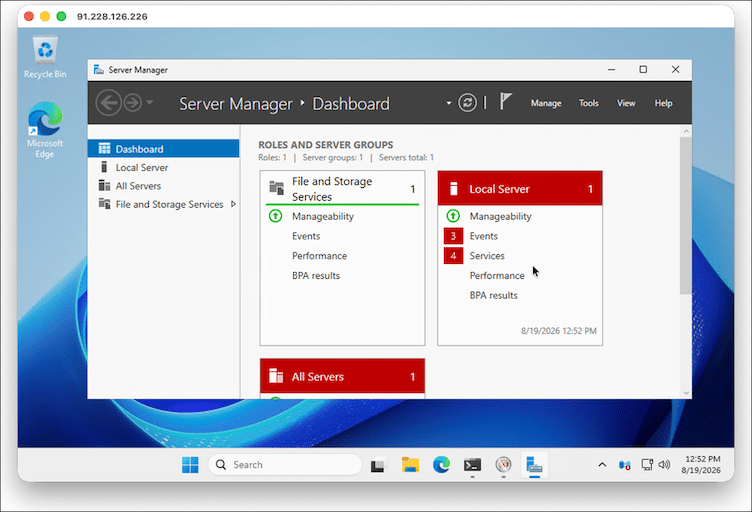
Kamatera’s Server Statistics shows you that a server’s Memory usage is high, but doesn’t show where the problem is or what’s causing it. Without this information, you can’t find the source or fix it. Finding the source means working directly on the server itself. Let’s start by opening the Kamatera console or launching a local RDP session.
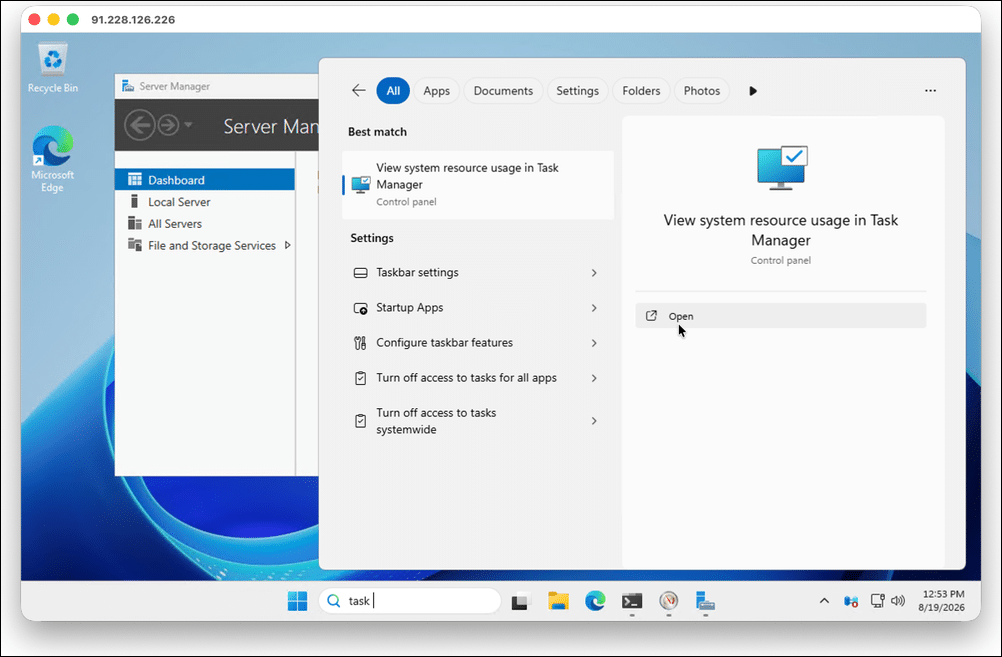
Once you’re on the server, we can see the size of the problem with Windows Task Manager. To get started, type Task Manager in the Start Bar’s Search box, and click Open.
To see how Windows is using system memory, open the Memory tab.
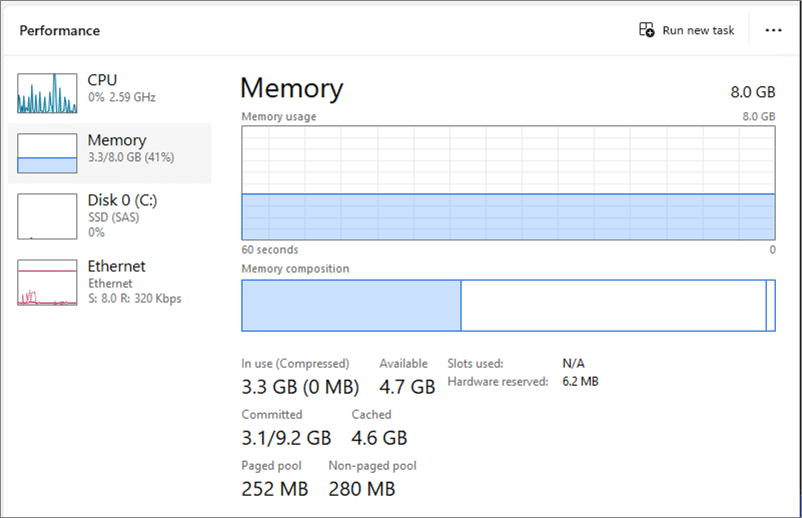
The Memory usage (top) graph shows total system memory usage. Memory composition shows how memory is divided between active data (left) and cached data (right). Below the graphs, the tab displays how much RAM is in use, available, and cached to disk (Committed, Cached, Paged pool, Non-paged pool).
Analyzing system-wide problems
Now that we know a problem exists, we need to determine whether it is a system-wide or lower-level issue. System-wide memory problems run in Kernel mode, which manages memory for shared operating system and driver tasks.
Windows Server provides these counters. This table shows the memory counters you can track, what they mean, and the values that may indicate a problem.
| Group | Counter | Meaning | Warning signs |
|---|---|---|---|
| Memory | Available MBytes | Total RAM immediately available | Consistently low |
| Memory | % Committed Bytes In Use | How much of the commit limit is consumed | Sustained >80–90% |
| Memory | Committed Bytes | Total RAM committed virtual memory | Continually increasing |
| Memory | Commit Limit | Maximum memory Windows can commit | Compare with Committed Bytes |
| Memory | Pages/sec | Pages read/written due to paging | Sustained high values need investigation |
| Memory | Page Reads/sec | Hard page faults requiring disk reads | Sustained activity can indicate memory pressure |
| Memory | Pool Nonpaged Bytes | Kernel memory that cannot be paged | Continuous unexplained growth |
| Memory | Pool Paged Bytes | Pageable kernel memory | Continuous unexplained growth |
| Paging | % Usage | Page file utilization | Sustained high usage |
| Process | Private Bytes | Memory committed to a specific process | Continuous growth may indicate a leak |
| Process | Working Set | Physical RAM currently associated with a process | Useful for identifying heavy consumers |
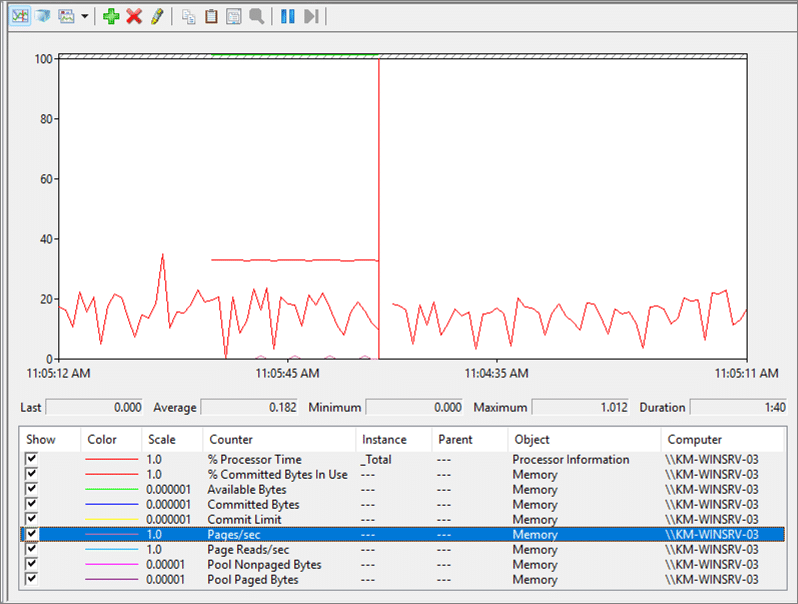
Using Windows Performance Monitor, we can collect this information and display it graphically. To launch Performance Monitor:
To launch Performance Monitor
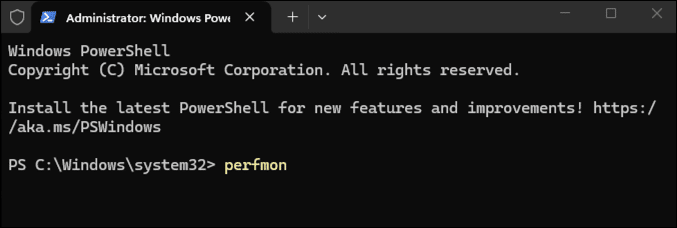
- Open a terminal and type perfmon.
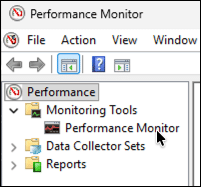
- In the Performance Explorer, click Performance Monitor.
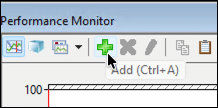
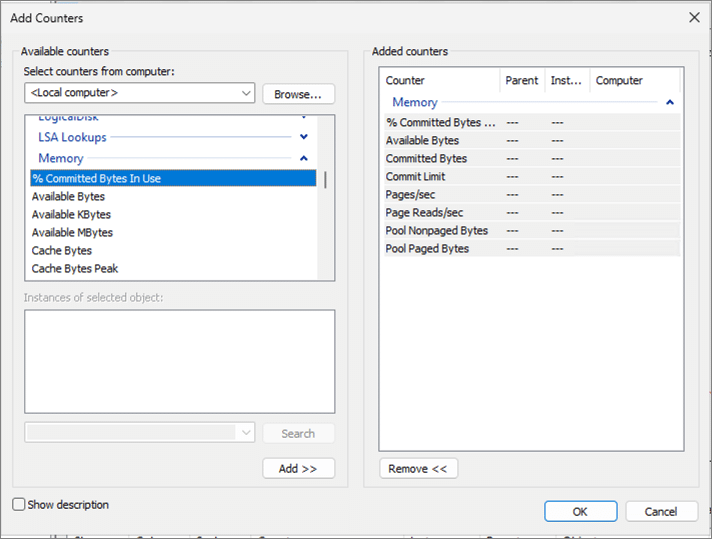
- In Performance Monitor, click the + icon.
- From Available Counters, choose Memory and add the values listed in the table above.
- In the graph, monitor the selected counters.
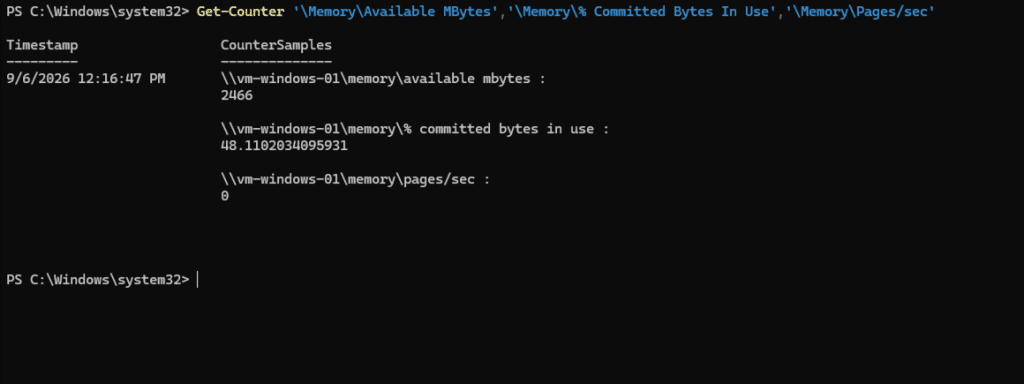
You can display kernel mode memory usage with PowerShell’s Get-Counter command. Use the following to continuously display the Available MBytes, Committed Bytes In Use, and Pages/sec counters.
Get-Counter '\Memory\Available MBytes','\Memory\% Committed Bytes In Use','\Memory\Pages/sec'
Isolating low-level issues
We now need to determine whether we can isolate our server’s memory issues to one or more user-related tasks, such as applications, processes, and related services. Windows manages these tasks in user mode.
We can identify individual tasks with high memory usage in Task Manager’s Processes View. This shows a list of applications and their processes. Click Memory in the top row to sort processes by Memory usage in descending order.
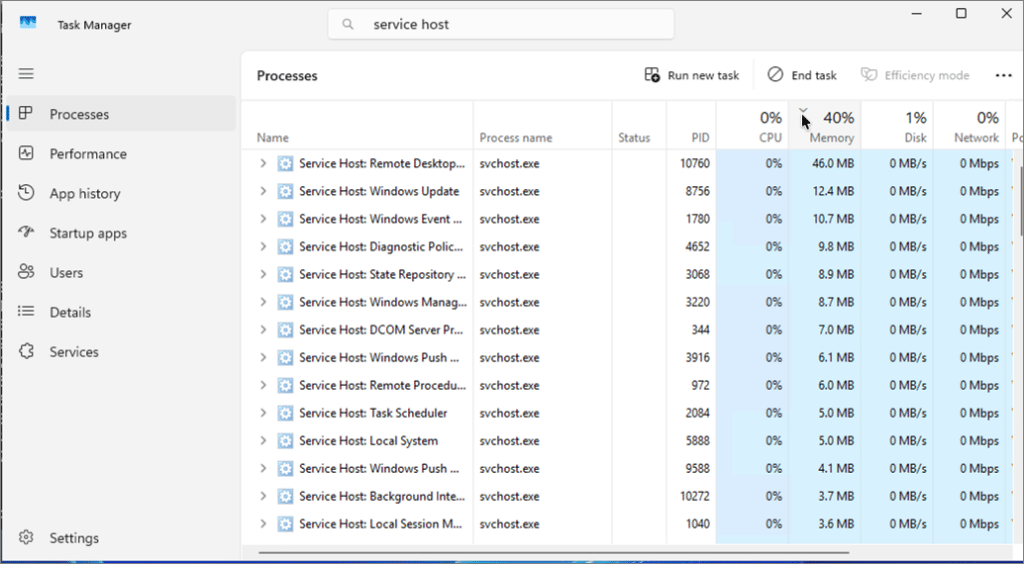
To display in-depth process information, right-click on a process. From the menu, choose Go to Details.
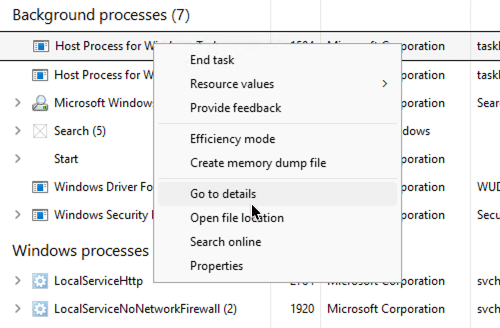
Details view shows each running process individually, rather than grouped by application, and lets you add or remove columns to display additional information.
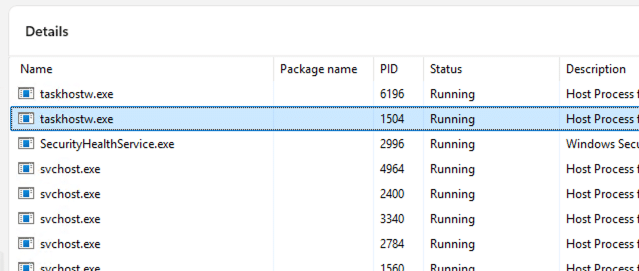
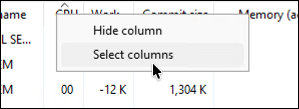
More importantly, it lets you add and remove columns to display additional information. To add a column, clickthe top row and choose Select Columns:
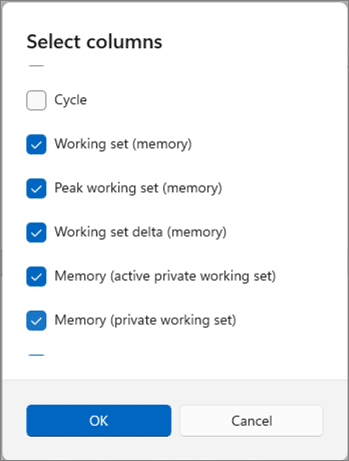
From the list, check and/or uncheck the columns you want to display. The most important indicator is the Working Set. This shows the total physical memory currently used by the process.
You can also display the following memory information:
- Working set delta: Change in working set memory used by the process
- Memory (active private working set): Total physical memory assigned for the process’s exclusive use, excluding suspended UWP processes
- Memory (private working set): Total physical memory assigned for the process’s exclusive use
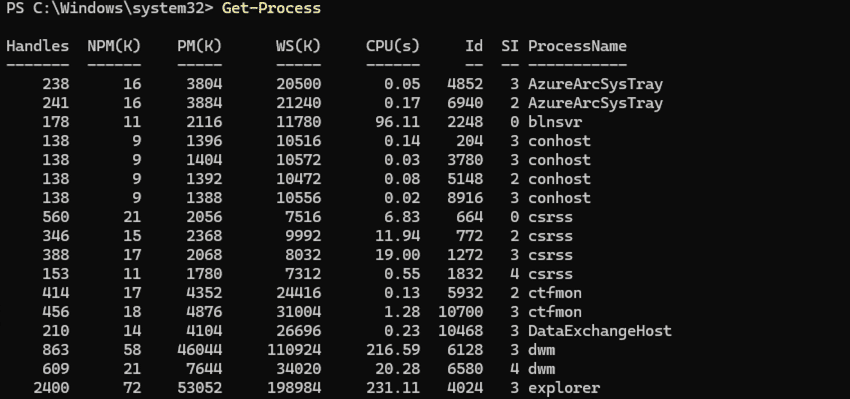
You can also locate processes with high RAM consumption with PowerShell. Open PowerShell and type:
Get-Process
This displays the following memory information for all running processes in KiloBytes (K):
- NPM(K): Non-paged memory used by the process
- PM(K): Paged/private memory used by the process
- WS(K): Working Set of physical RAM assigned to the process.
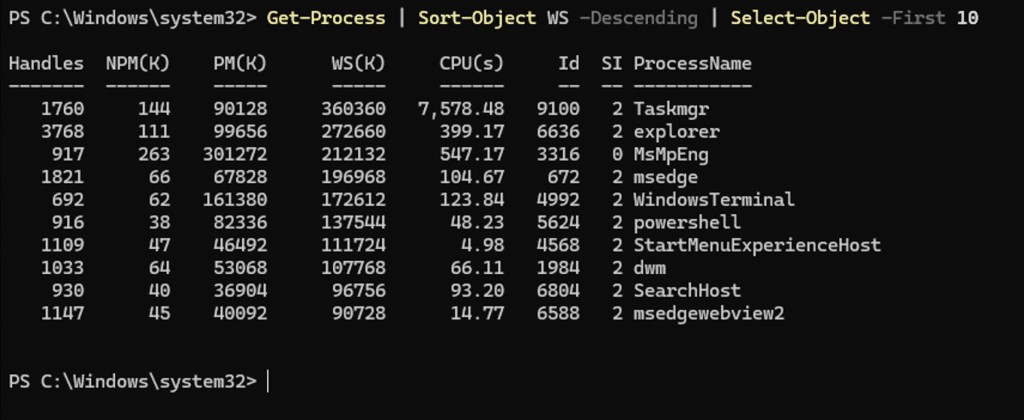
To make it easier to find the process with the heaviest memory Working Set (WS) usage, use this command to find the top ten processes by WS usage, sorted in descending order:
Get-Process | Sort-Object WS -Descending | Select-Object -First 10
Troubleshooting and resolving high memory usage
This table displays the memory counters you can track, what they mean, and the values that indicate potential or actual problems.
| Mode | Cause | Source | Resolution |
|---|---|---|---|
| Kernel | Applications, kernel pools, cache, or insufficient installed RAM | Determine which memory category is consuming RAM before taking corrective action | Determine which memory category is consuming RAM before taking corrective action |
| Insufficient physical RAM | Workload exceeds server’s physical-memory capacity | Add RAM, increase VM allocation, reduce workload, or redistribute services | |
| Application/process memory usage | Windows filesystem caching | Usually no action; investigate only when accompanied by genuine memory pressure | |
| Driver problem | Faulty/outdated network, storage, antivirus, backup, filter, or other driver | Update, replace, or delete driver | |
| User | Application/process memory usage | SQL Server, IIS, Java/.NET apps, third-party applications | Tune application or add RAM if workload requires |
| Too many processes/services | Excessive applications, services, agents, monitoring/security tools | Remove/disable unnecessary services; consolidate workloads; add RAM if workload is legitimate | |
| Application memory leak | Application or service continually allocating memory | Patch/update application
Fix application code Restart service |
|
| Incorrect application memory configuration | SQL Server max memory, JVM heap, application caches | Configure appropriate application memory limits |
Conclusion: Why memory management matters
For Windows Server-based systems, available memory directly impacts performance and user experience, and affects a wide range of applications, including SQL Server, IIS, and Exchange. Ensuring a server always has sufficient available memory is essential to keeping these systems running reliably.
In this article, we explained why memory management matters, then covered the tools that Kamatera, Windows Server, and PowerShell provide to monitor and troubleshoot memory issues. Use this knowledge to keep your own systems running smoothly.