



Uptime Kuma monitors websites, apps, servers, and APIs from a single web dashboard. When it detects a problem, it can send alerts through many messaging platforms and email services. If you only need uptime checks and alerts, it is a simpler option than a full metrics stack such as Prometheus and Grafana.
This article shows you how to deploy Uptime Kuma on a Kamatera server, create a monitor, set up email alerts, and publish a status page.
Step 1: Provision a server
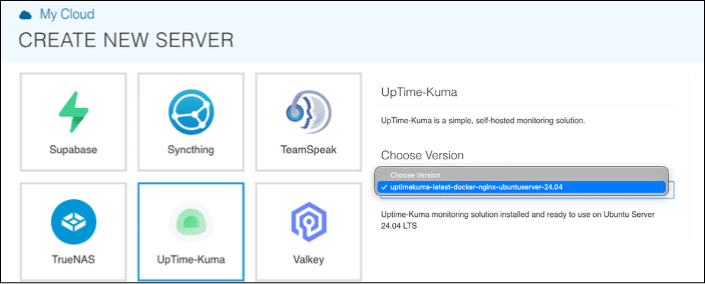
First, provision an Uptime Kuma server as described here.
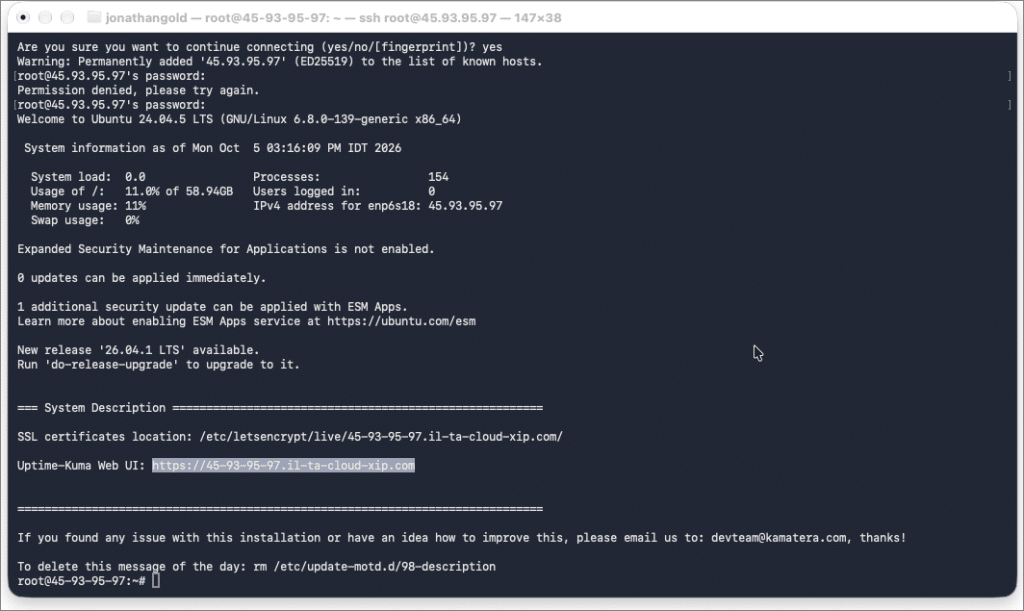
After the server is provisioned, connect to it through the Kamatera console or a local SSH terminal window (see our guide on How to Use SSH to Connect to a Remote Server). After a successful login, the application banner is displayed.
In the console, run docker ps. In the output, verify that the Uptime Kuma Docker container is listed with an Up status.
docker ps

Step 2: Configure Uptime Kuma
Now that the server is running, open the web UI and configure the app.
From your SSH session, copy the URL of the Uptime Kuma web UI.
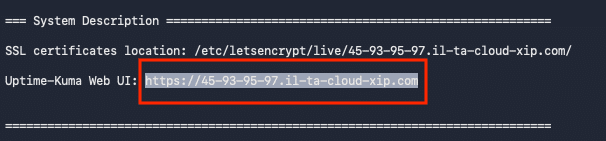
Then paste the URL into your browser.

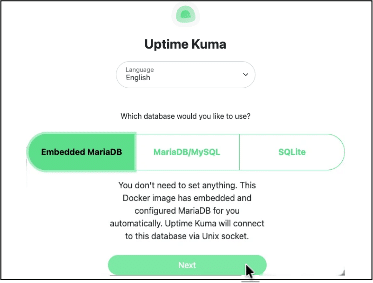
In Which database would you like to use?, click Embedded MariaDB. This option needs no additional setup. Then, click Next.
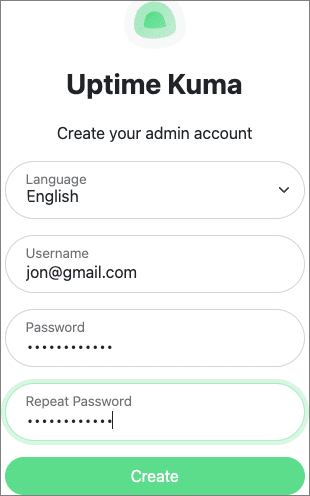
In Create your admin account, enter your email address in Username, and then enter a password in Password and Repeat Password. Then, click Create.
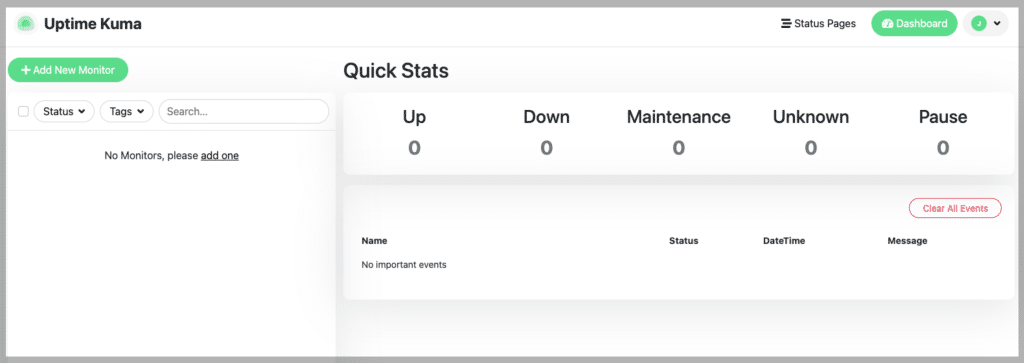
The Dashboard page opens.
Step 3: Monitor a server
With the dashboard running, you can monitor server uptime. The simplest way is to ping a network device to check that it is up. For example, running ping from the command line returns a response like this:
ping <hostname>
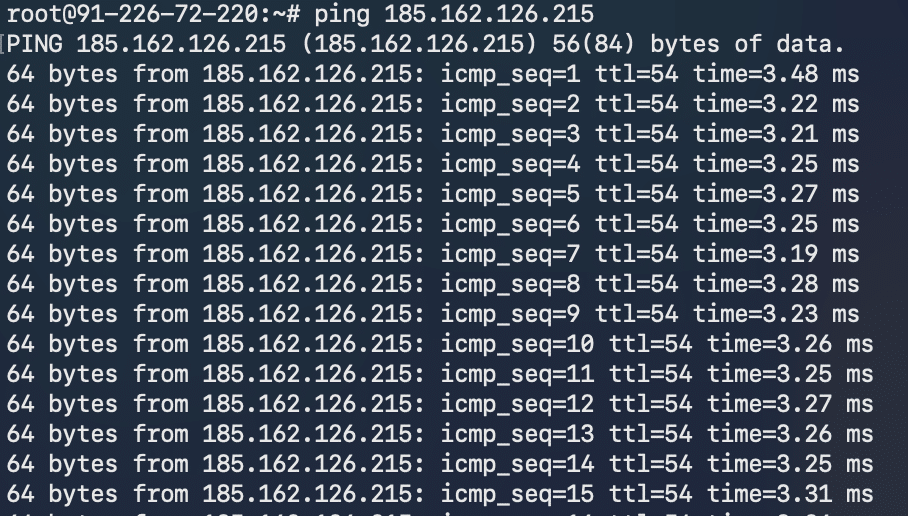
Each ping sends a packet to a target and measures how long it takes to receive a response. If no response comes back, the target may be down or unreachable. Some servers and firewalls also block ping on purpose.
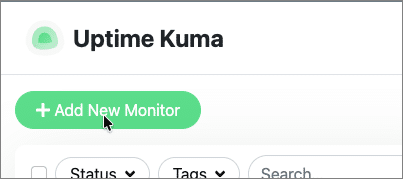
In the Dashboard, click +Add New Monitor.
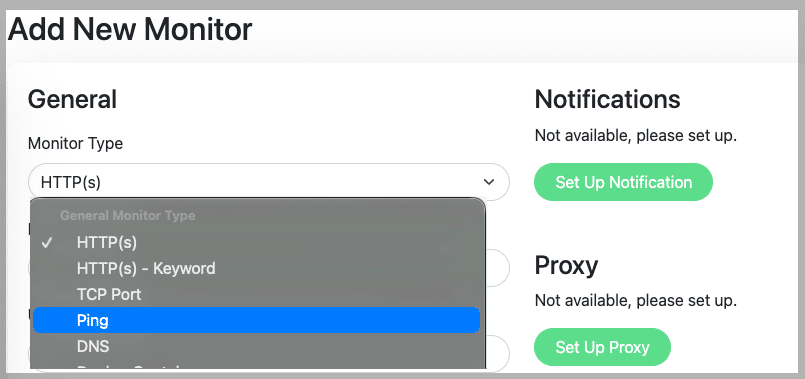
On the Add New Monitor page, open the Monitor Type menu and choose Ping.
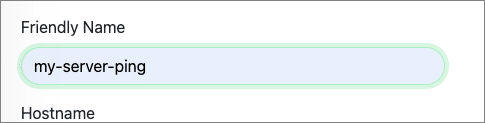
In Friendly Name, type a name for the monitor.
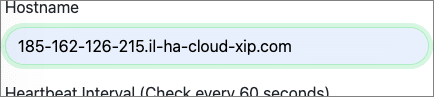
From the Kamatera console, copy the hostname of the server you want to monitor. In Hostname, paste the copied hostname.
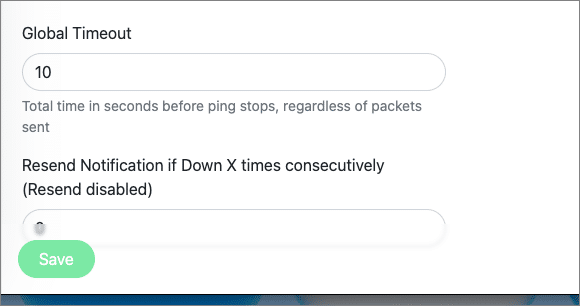
Click Save.
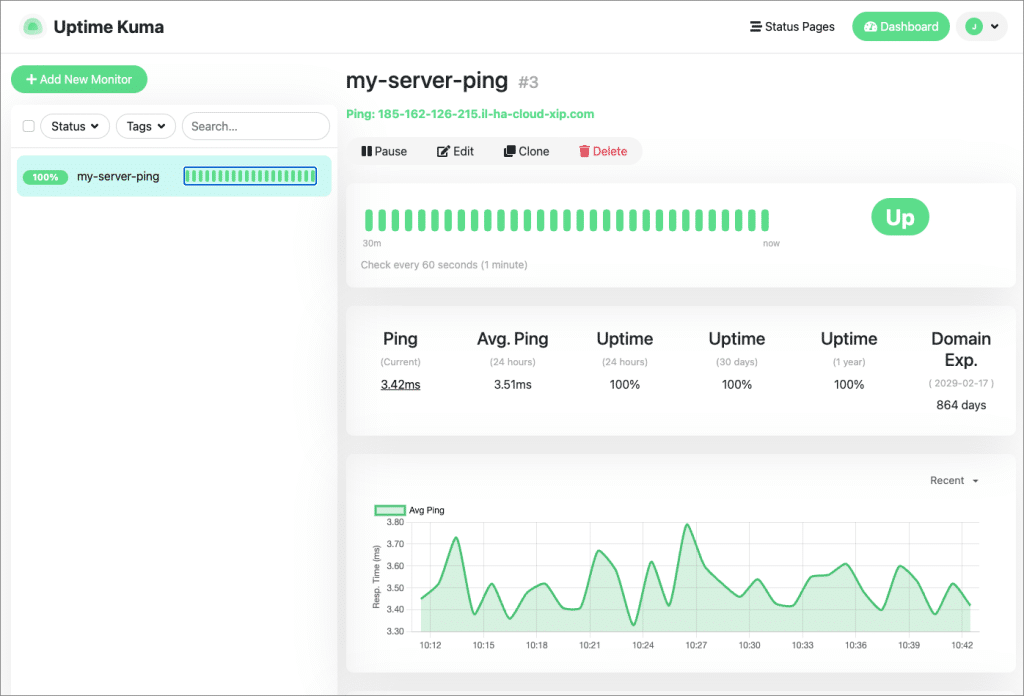
The Dashboard displays the monitor you created.
Step 4: Create a notification
Uptime Kuma can also send alerts through many messaging platforms. This step shows you how to send notifications through Gmail.
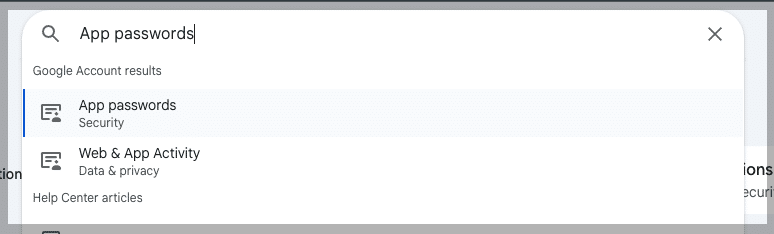
First, open your Google Account page and search for App passwords. App passwords are available only when 2-Step verification is turned on for your account.
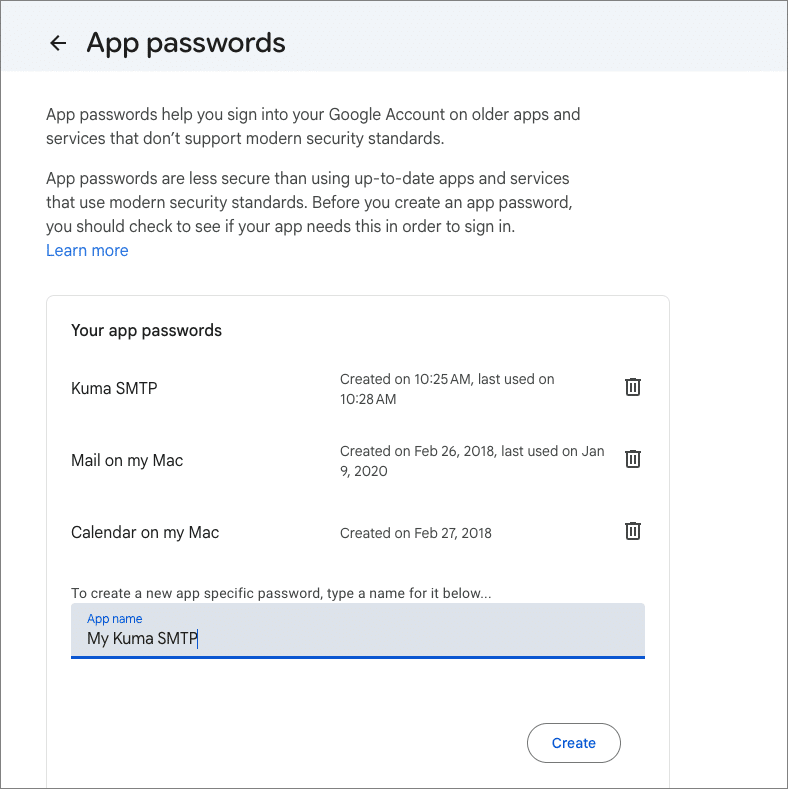
In App passwords, type a name for the app password, such as Uptime Kuma, and click Create.
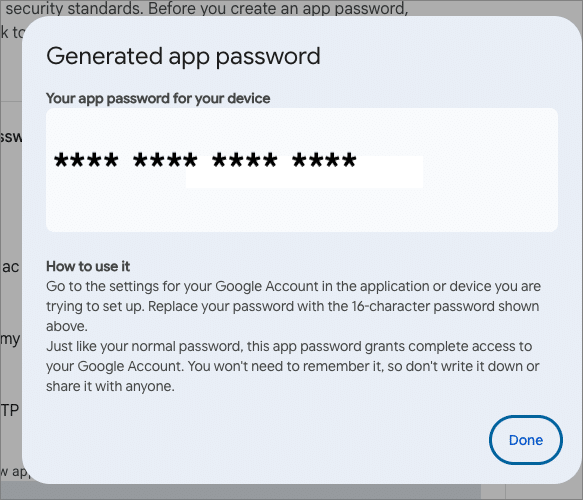
In the Generated app password dialog, copy the password and keep it somewhere safe. You will paste it into Uptime Kuma later in this step. Click Done to close the dialog.
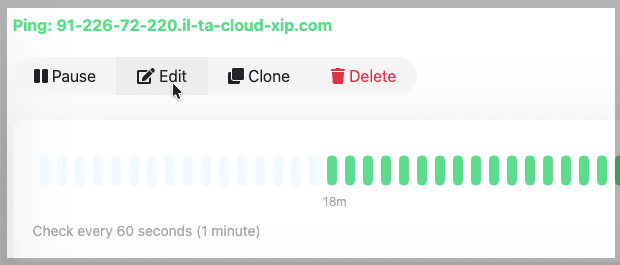
In the Dashboard, open the monitor you created in Step 3 and click Edit.
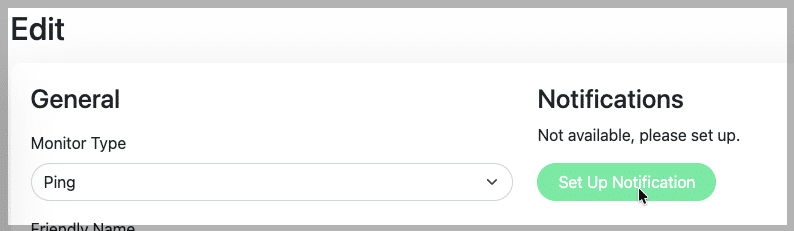
In Edit, click Set Up Notification.
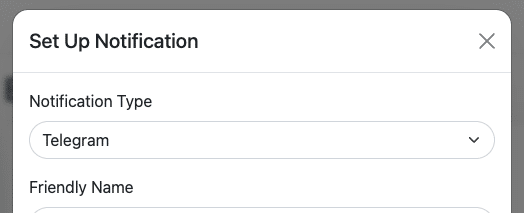
In Set Up Notification, open the Notification Type menu.
[uptime-kuma-0020-03.png]
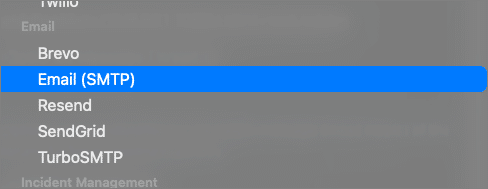
From the list, choose Email (SMTP).
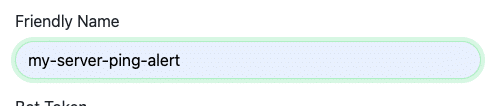
In Friendly Name, type a name for the alert.
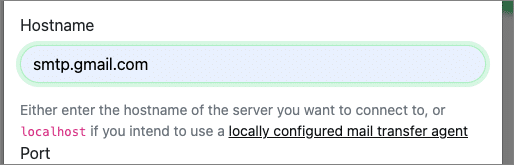
In Hostname, type the Gmail SMTP server address: smtp.gmail.com.
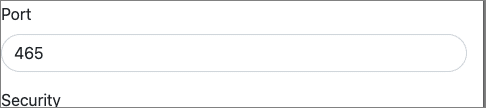
In Port, type 465.
From Security, choose TLS.
In Username and From Email, enter your Gmail address. In To Email, enter the address that should receive alerts. In Password, paste the app password you generated.
Click Test to send a test email.

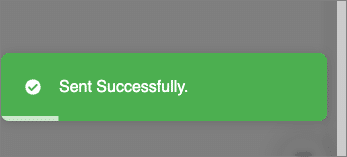
If the email is sent successfully, a confirmation message appears.
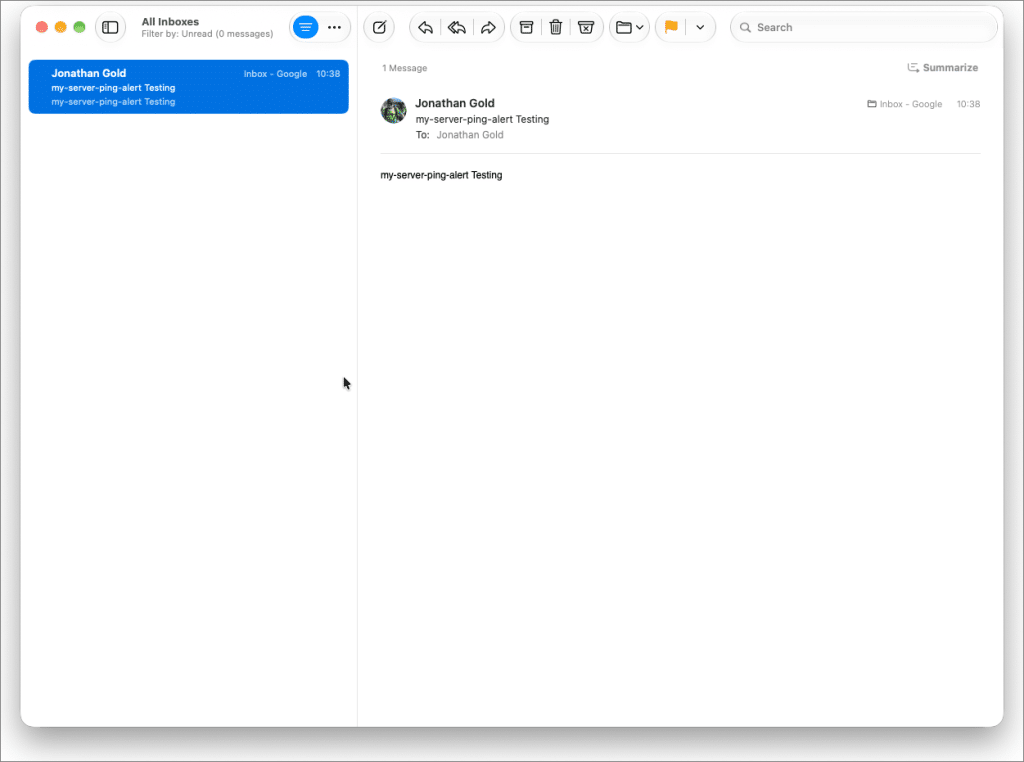
Check your inbox for the test email.
Click Save to save the notification. Then, save the monitor so the notification is applied to it.
Step 5: Build a status page
The Dashboard shows all your monitors, but only you can see it. A status page publishes the status of selected monitors on a public page that anyone can view.
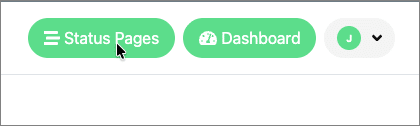
In the Dashboard, click Status Page.
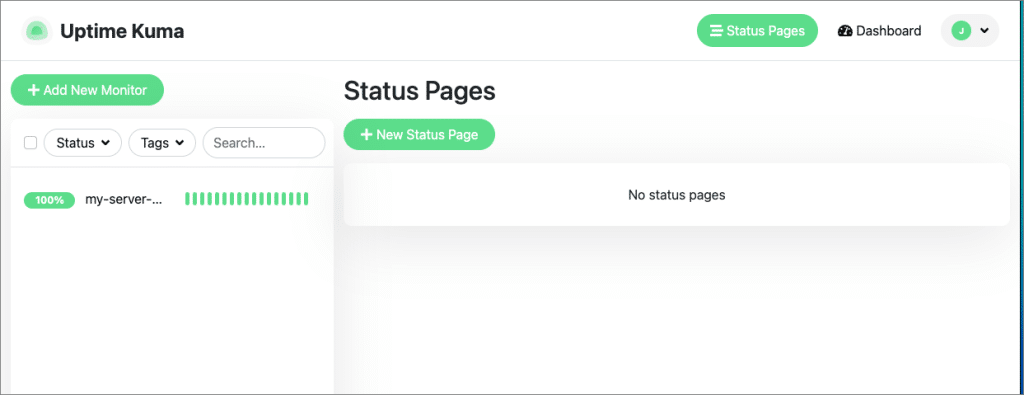
In Status Pages, click +Status Pages.
In Add New Status Page, enter a Name and a Slug. The slug is the last part of the status page’s web address.
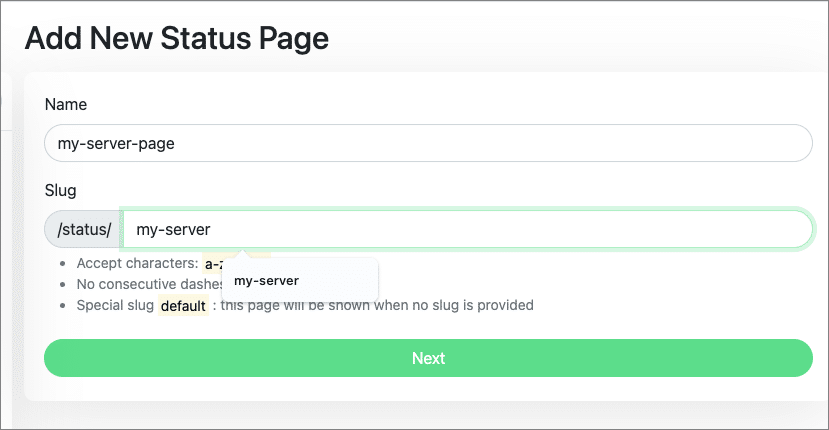
Click Next.

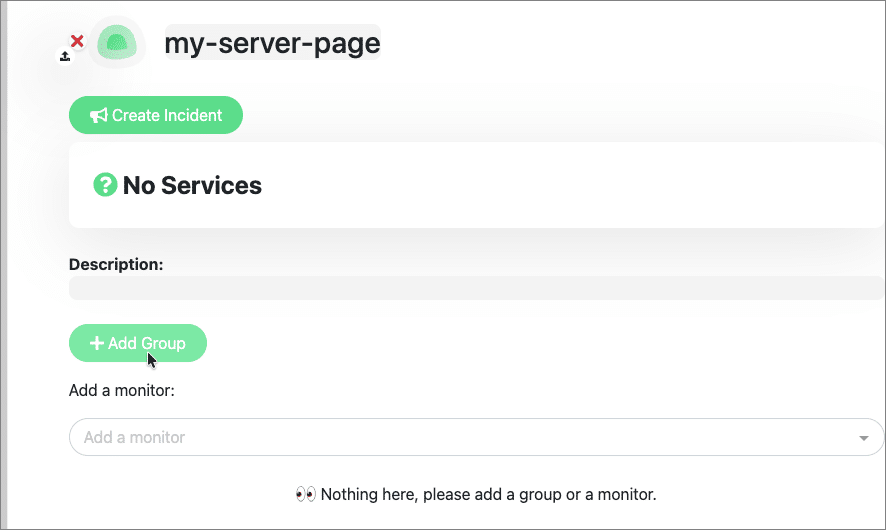
Next, add your monitor to the page. On the status page, click +Add Group.
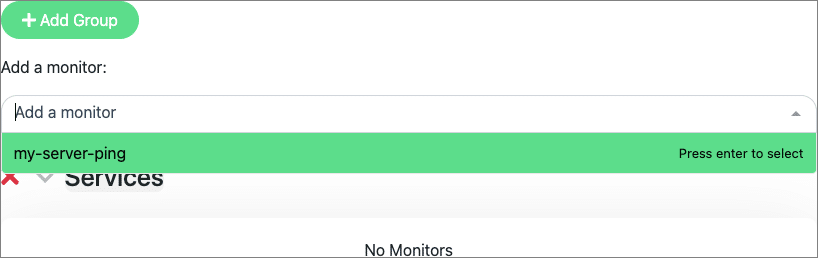
 From Add a monitor, choose your monitor.
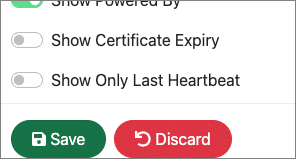
Click Save.
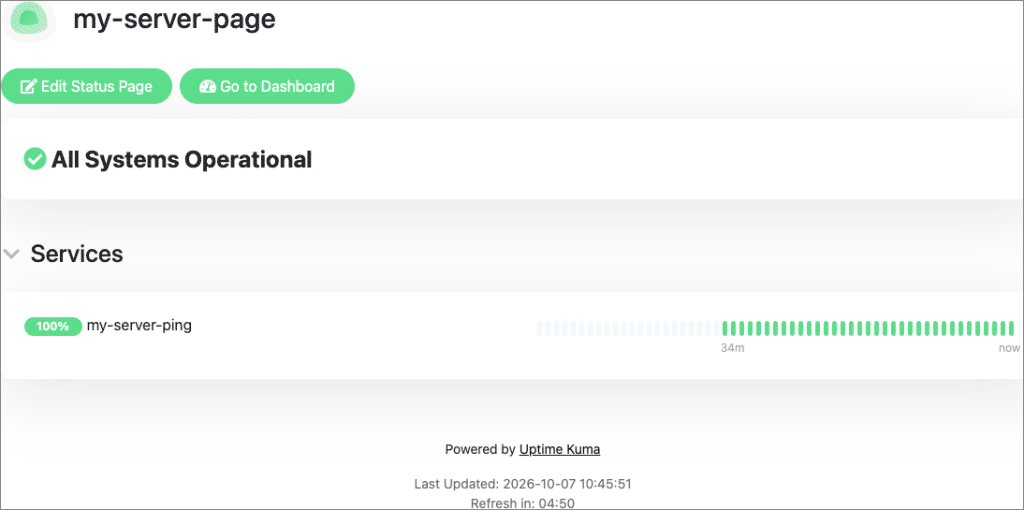
The page updates and displays the service.
Conclusion
In this article, you configured Uptime Kuma, created a ping monitor, set up Gmail alert notifications, and built a public status page. With Uptime Kuma running on your Kamatera server, you will know when your websites and services go down, and your visitors can check their status on a public page.