



Prometheus is a powerful, open-source system monitoring tool. It excels at data collection but is limited in data analysis and visualization. Unless you know exactly what you’re looking for, you could easily miss important information. That’s why you need Grafana. Grafana is a data visualization platform that connects directly to multiple data sources, including Prometheus and many more. Like Prometheus, Grafana is open-source.
To simplify getting the most out of these platforms, Kamatera lets you provision your own dedicated Prometheus and Grafana servers as demonstrated in this article’s three parts:
- Provisioning application servers
- Installing, configuring, and using Prometheus
- Visualizing data with Grafana
Before we get started, we will provision two separate servers, which may incur additional charges, depending on your plan. You may want to consider this alternative, Docker-based approach.
Before you log in and configure your servers, we recommend creating a virtual LAN (VLAN) so they can communicate. This ensures all communications are restricted to the VLAN and not accessible over the public internet/WAN. To learn how to create a VLAN, see How do I add a new VLAN?
Provision application servers
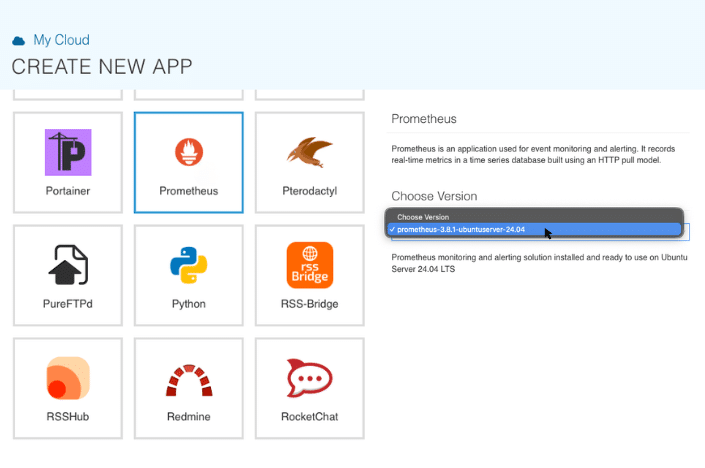
Create two Ubuntu servers, each running Prometheus or Grafana as a service. In My Cloud on the Kamatera console, open Create New App and select an app. The screenshots in this section show Prometheus, but the process is identical for Grafana.
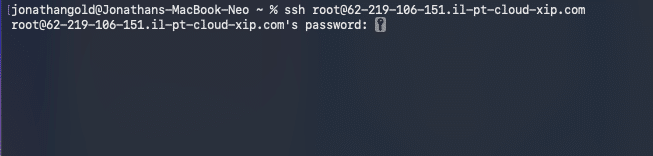
Once the server is provisioned, connect to it through the Kamatera console or a local SSH terminal.
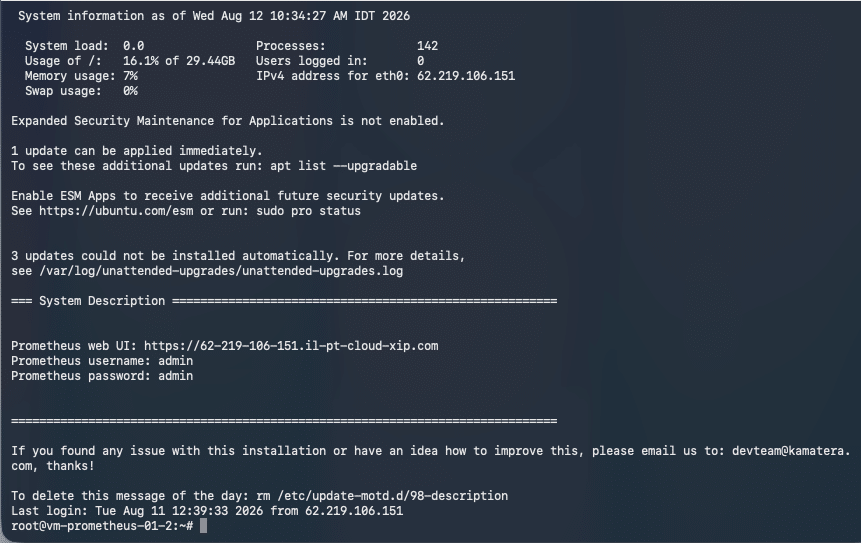
After a successful login, the application banner appears.
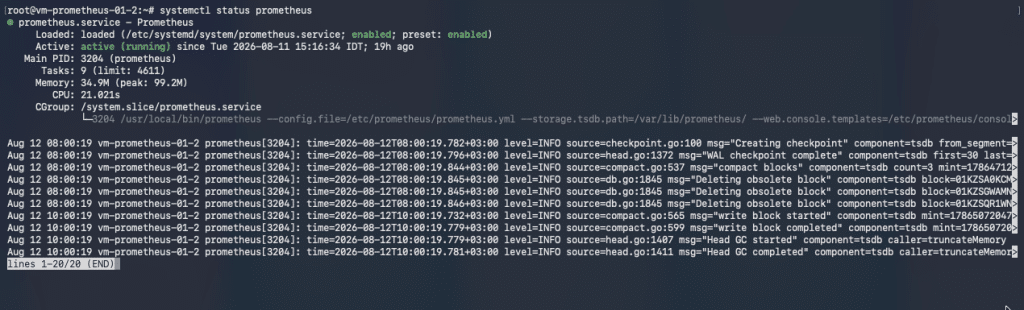
Verify the service is running:
systemctl status <app>
Where <app> is Prometheus or Grafana.
Installing, configuring, and using Prometheus
Before you can visualize and analyze monitoring data, you need to collect it with Prometheus. Here’s the process:
- Install the Node Exporter
- Configure Prometheus
- Launch the web interface
- Query and view collected data
Install Node Exporter
With your server provisioned and Prometheus running, you need a way to collect monitoring data for storage and processing. Prometheus’s Node Exporter is a small, lightweight tool built for exactly this.
In your Prometheus SSH window, download the archive file. Check the Node Exporter releases page for the current version, then run:
wget
https://github.com/prometheus/node_exporter/releases/download/v1.12.1/node_exporter-1.12.1.linux-amd64.tar.gz
Extract the archive:
tar xvfz node_exporter-*.tar.gz
Move the binary so it’s accessible across the host’s file system:
mv node_exporter-1.12.1.linux-amd64/node_exporter /usr/local/bin
Create a Node Exporter service
You could launch Node Exporter directly with node_exporter, but this runs it in the foreground, meaning you’d need a new SSH session to continue configuration. Instead, set it up as a background service.
Create a node_exporter user:
sudo useradd -rs /bin/false node_exporter
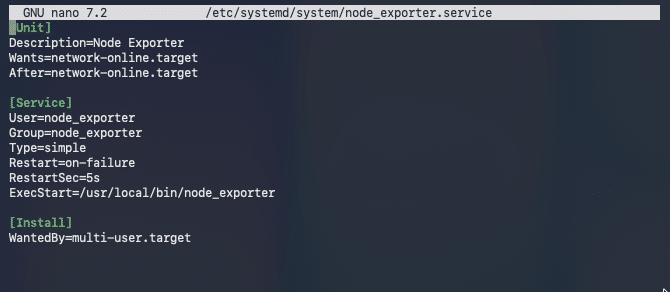
Create a service configuration file:
nano /etc/systemd/system/node_exporter.service
Paste in these settings:
[Unit]
Description=Node Exporter
Wants=network-online.target
After=network-online.target

[Service]
User=node_exporter
Group=node_exporter
Type=simple
Restart=on-failure
RestartSec=5s
ExecStart=/usr/local/bin/node_exporter

[Install]
WantedBy=multi-user.target
Set the following system commands:
|
Command |
Explanation |
|
systemctl daemon-reload |
Tells the service manager to reread all service configuration files and reload each service |
|
systemctl enable node_exporter |
Launches the service automatically on system boot |
|
systemctl start node_exporter |
Starts the Node Exporter service |
|
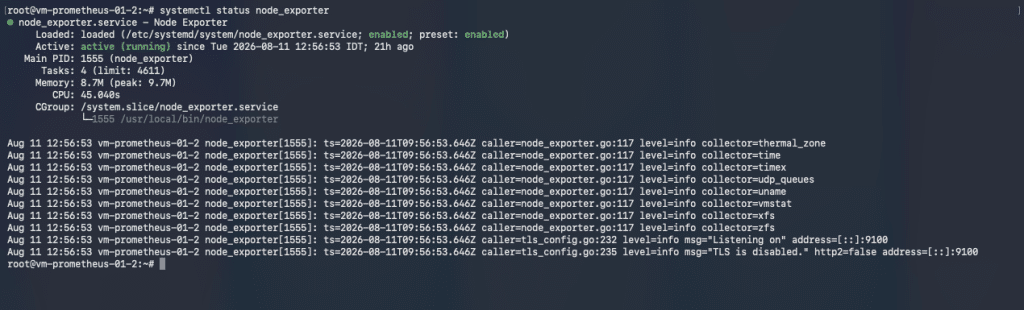
systemctl status node_exporter |
Displays the service’s current status, as shown below |
Finally, to ensure that Prometheus can access Node Exporter and display the data, let’s open the service port to the Prometheus server only:
ufw allow from <PROMETHEUS_IP> to any port 9100 proto tcp
Replace <PROMETHEUS_IP> with your Prometheus server’s IP address.
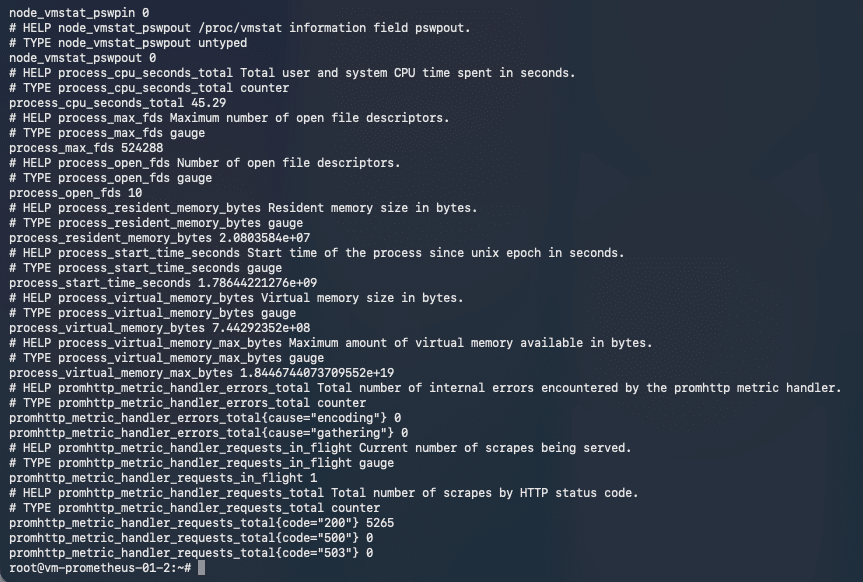
To see Node Exporter in action, run:
curl http://localhost:9100/metrics
Each collected metric is displayed:
Configure Prometheus
Next, configure Prometheus to use the exported node data. Open the configuration file:
nano /etc/prometheus/prometheus.yml
Under scrape configs, add:
yaml
- job_name: "remote_collector"
scrape_interval: 10s
static_configs:
- targets: ["<host_ip>:9100"]
Replace <host_ip> with the IP address Kamatera assigned to your server, shown below.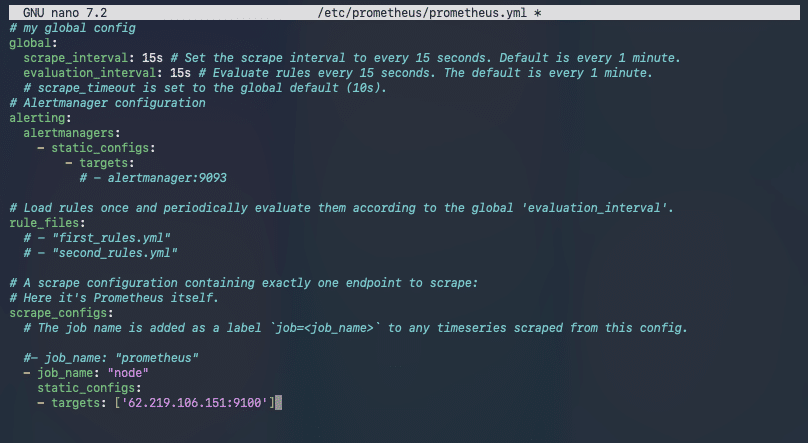
After saving the file, reload Prometheus:
systemctl reload prometheus
Check the service’s status:
systemctl status prometheus
To let Grafana connect to Prometheus and query it via the Prometheus API, run this from /etc/prometheus:
prometheus --web.listen-address=0.0.0.0:9090
Launch the web interface
With Prometheus running and configured, this step and the next are optional, but we recommend launching the Prometheus web UI to confirm data is being collected and processed correctly.
In your browser, enter the address of the Prometheus web client. You can copy this address, along with the login credentials, from the screen shown after you log in.
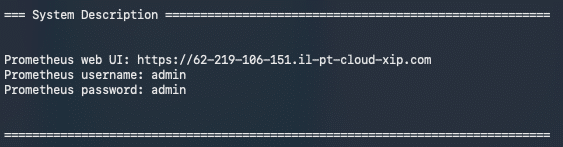
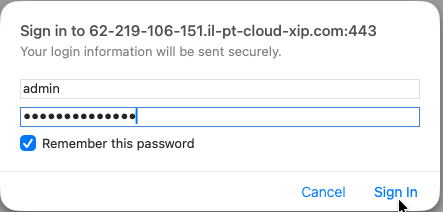
When the page opens, log in with the system credentials.
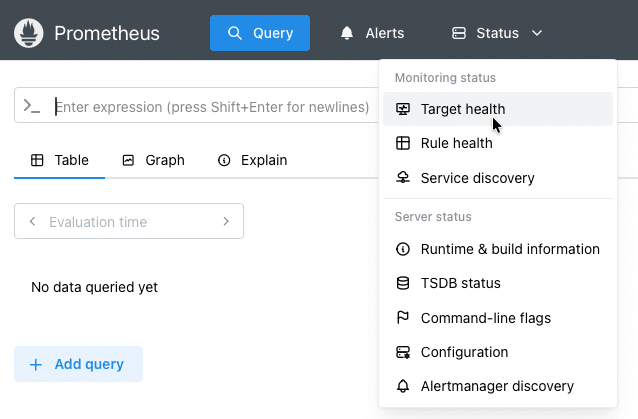
After logging in, confirm that Prometheus has successfully imported Node Exporter data. From the Status menu, select Target Health.
The Target Health page shows the monitored node with a State of Up.
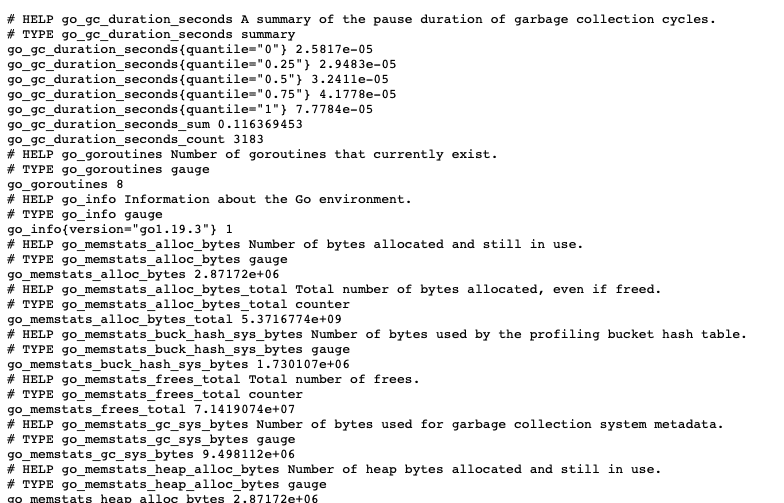
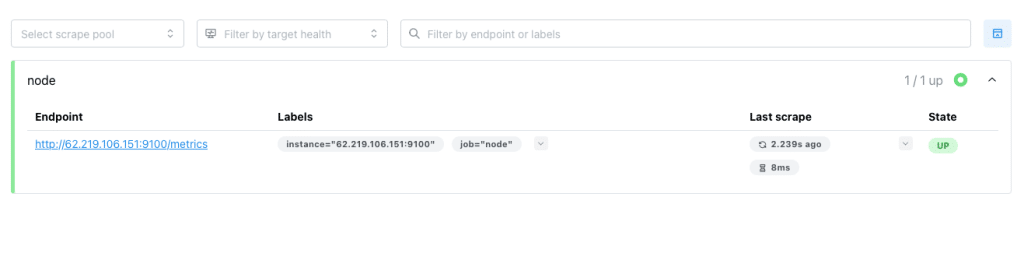 To view collected node data, click the Endpoint link. On the Node Exporter page, click Metrics.

The monitored data is displayed:
Query and view collected data
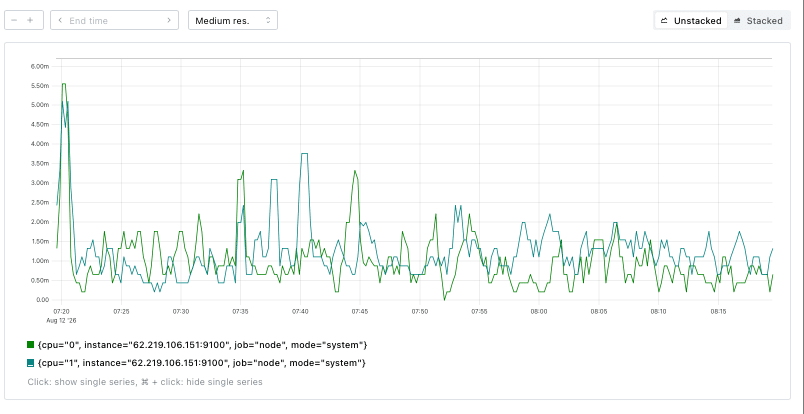
To see what Prometheus can do with the collected data, and why you’ll still want Grafana, click Query in the menu bar.

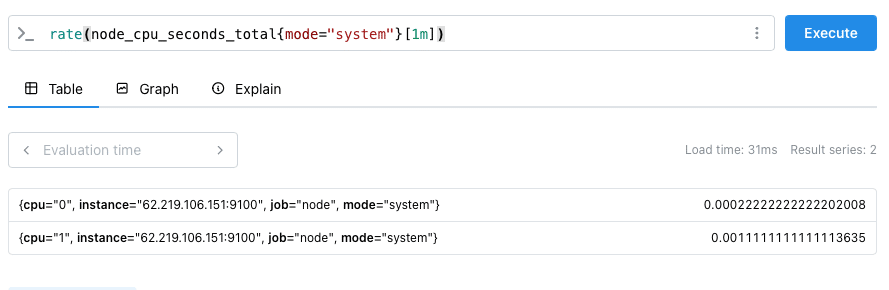
To view the average CPU time spent in system mode per second, averaged over the last minute, enter this query in the Expression box:
rate(node_cpu_seconds_total{mode="system"}[1m])
 Press Execute to see the result:
To visualize the data, click Graph.
Visualizing data with Grafana
Prometheus handles data collection well, but Grafana is where that data becomes usable. Here’s how to connect the two and build dashboards:
Part 1: Connecting Grafana and Prometheus
In your browser, enter the address of the Grafana web client. You can copy this address, along with the login credentials, from the screen shown after you log in.
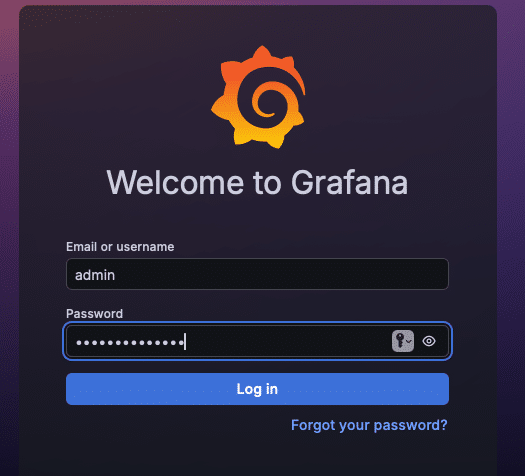
On the login page, enter your credentials. The default credentials aren’t secure, so Grafana will prompt you to update them.
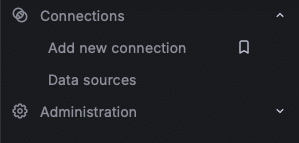
In the sidebar, click Connections, then Add new connection.
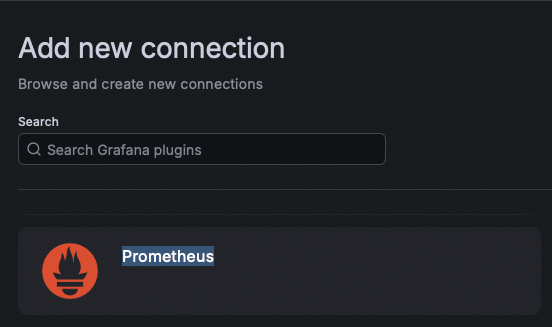
In the Add new connection window, select Prometheus.
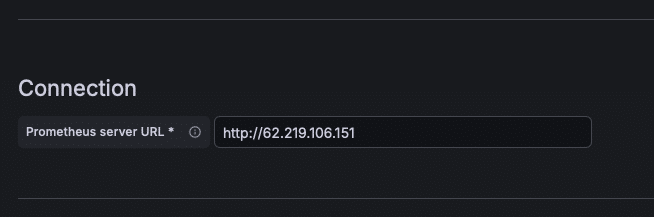
Under New connection > Connection, enter the URL of your Prometheus server.
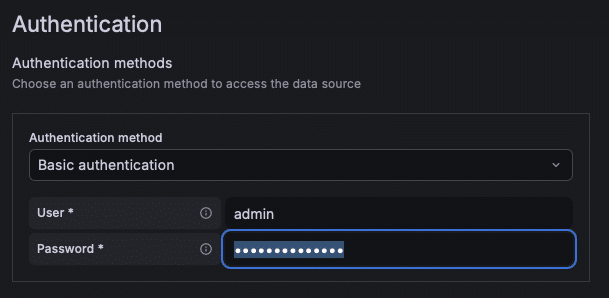
Under Authentication, set the authentication method to Basic authentication, then enter your server’s credentials.
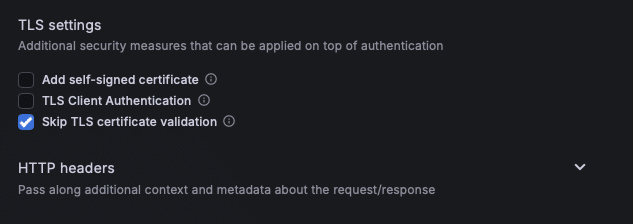
Under TLS settings, check Skip TLS certificate validation.
At the bottom of the page, click Save & test.
 When Grafana establishes a connection, the following message is displayed.

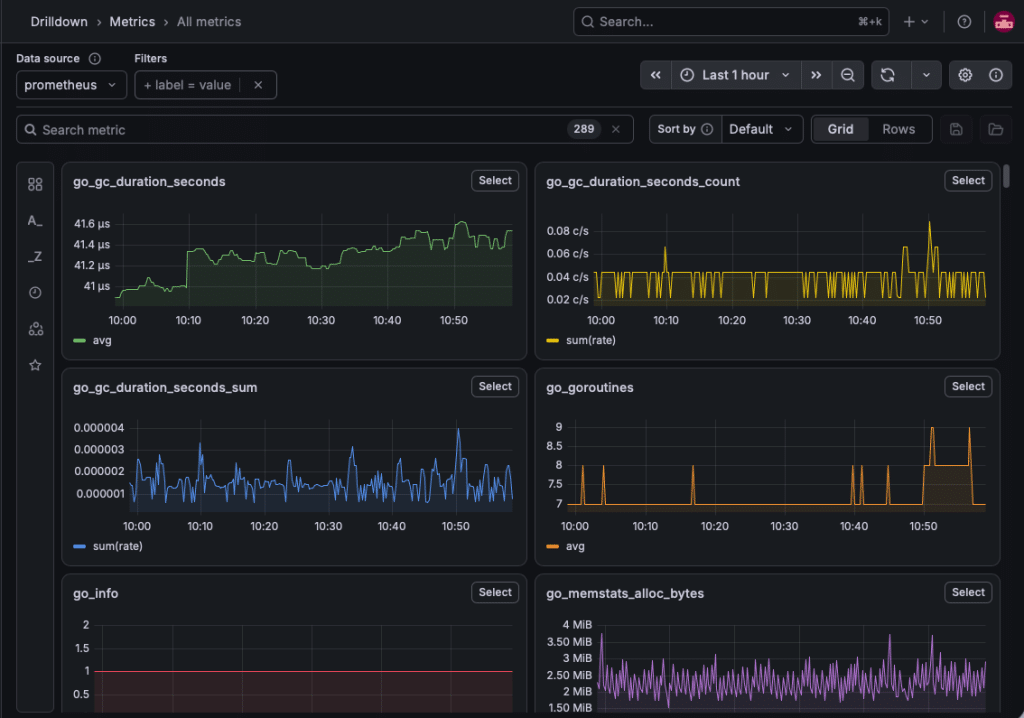
Click Open in Metrics Drilldown to visualize the collected data.
Part 2: Build a dashboard
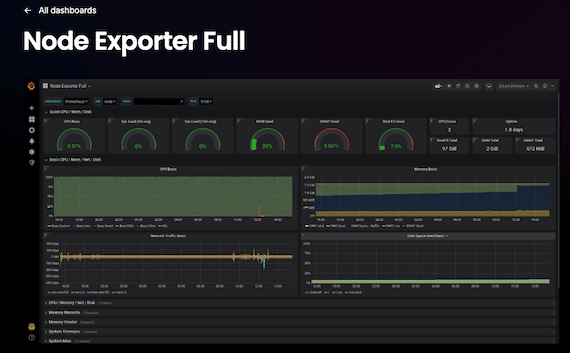
Grafana makes it easy to build and customize dashboards. To get started, use a sample dashboard from Grafana: download the latest version of the Node Exporter Full dashboard.
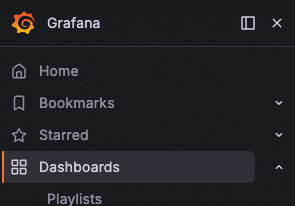
From the sidebar, click Dashboards.
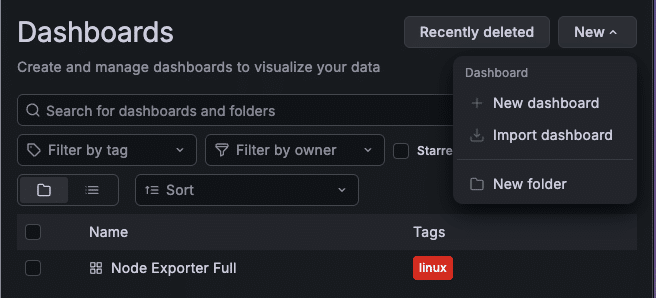
In the Dashboards window, click New, then Import dashboard.
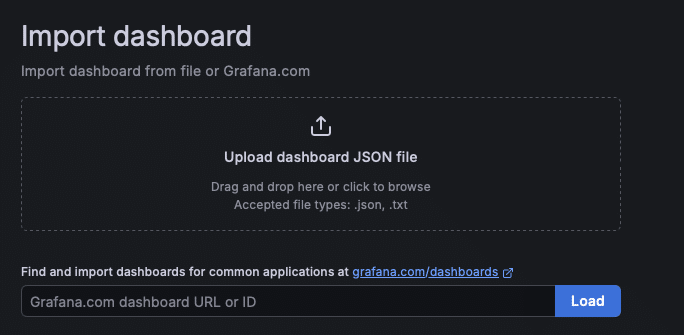
Upload the downloaded dashboard file, either by dragging and dropping it or selecting it from your local file system. Then click Load.
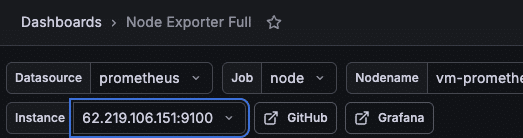
The dashboard is displayed.
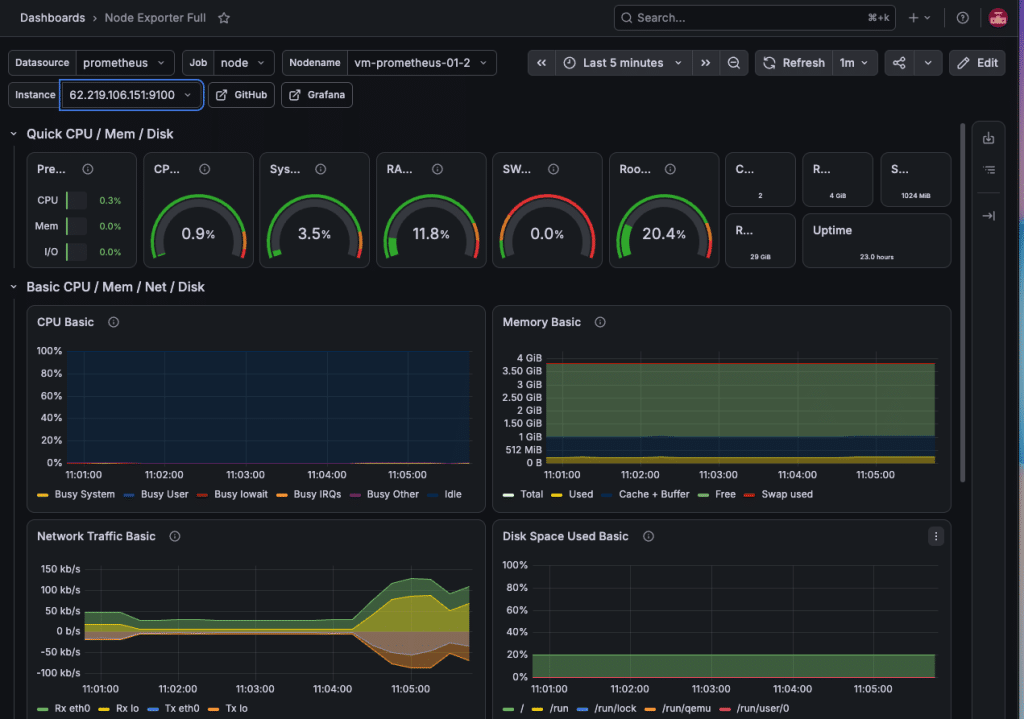
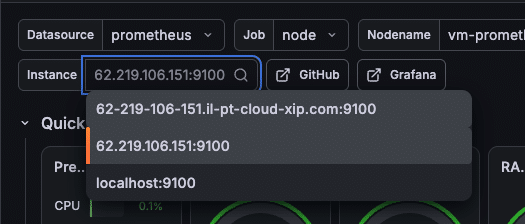
Note that if no data is displayed, select the Prometheus server’s IP address and port.
 Conclusion
Choosing a monitoring system usually means trading convenience for comprehensiveness: an all-in-one tool is easier to set up but limited, while a more powerful system takes more effort to configure and maintain.
Prometheus and Grafana together remove that tradeoff. Setting up and connecting the two is straightforward. Kamatera simplifies it further by letting you deploy cloud servers with Prometheus and Grafana pre-installed and running as services. The result is a complete, extensible monitoring platform without a heavy setup process.