


Prometheus and Grafana are commonly used together to monitor servers and applications using metrics. Prometheus collects metrics from systems that expose a /metrics endpoint and stores them as time series data. Grafana connects to Prometheus and visualizes those metrics using dashboards and charts.
In this guide, we will set up Prometheus and Grafana using Docker Compose. We will add Node Exporter to expose Linux host metrics (CPU, memory, disk, network) and configure a basic alerting example using Prometheus alert rules and Alertmanager. By the end, you will have a working monitoring stack you can extend for real workloads.
Here Node Exporter exposes server metrics on a /metrics endpoint (machine readable). Prometheus scrapes and stores them. Grafana visualizes them in dashboards.
The same setup works on a VPS. For the walkthrough and screenshots, we use a laptop. On a VPS, replace localhost with your server IP or domain, open required ports if needed, and secure access to Grafana and Prometheus.
Prerequisites and project setup (Docker-based)
We will run the entire monitoring stack using Docker containers. This keeps the setup consistent across laptops and VPS environments and avoids installing Prometheus or Grafana directly on the OS.
Prerequisites:
- Docker installed and running
- Docker Compose available (Docker Desktop includes it on Windows, Docker Compose plugin works on Ubuntu servers)
- A terminal to run commands and a browser to access Prometheus and Grafana
What we will run:
- Prometheus (collects and stores metrics)
- Grafana (dashboards and visualization)
- Node Exporter (exposes Linux host metrics for Prometheus)
- Alertmanager (receives alerts fired by Prometheus)
Project setup:
In the next section, we will create a project folder and add the required configuration files. The final folder structure will look like this:
prometheus-grafana/

  docker-compose.yml

  prometheus/

    prometheus.yml

    alert_rules.yml

  alertmanager/

    alertmanager.yml
Your folder should look similar to this:

Ports and access URLs (used later):
- Grafana: http://localhost:3000
- Prometheus: http://localhost:9090
- Alertmanager: http://localhost:9093
- Node Exporter metrics endpoint: http://localhost:9100/metrics
VPS note: On a VPS, you can follow the same steps. For accessing the UIs, the simplest secure approach is SSH port forwarding, so you can still use the same localhost URLs from your laptop browser.
Create the project files and Docker Compose setup
In this section, we will create the project folder, add configuration files for Prometheus and Alertmanager, and define all services using Docker Compose.
In this section, you will run a few commands in the terminal. For the configuration blocks (YAML), open the file in a text editor and copy-paste the content exactly as shown, including indentation.
Step 1: Create the project folder and file structure
From your terminal, create a folder for the stack and the required subfolders:
mkdir -p prometheus-grafana/prometheus prometheus-grafana/alertmanager

cd prometheus-grafana
Create the empty files we will fill in next:
touch docker-compose.yml prometheus/prometheus.yml prometheus/alert_rules.yml alertmanager/alertmanager.yml
Your folder structure should now match what we listed earlier.
Step 2: Add the Docker Compose configuration
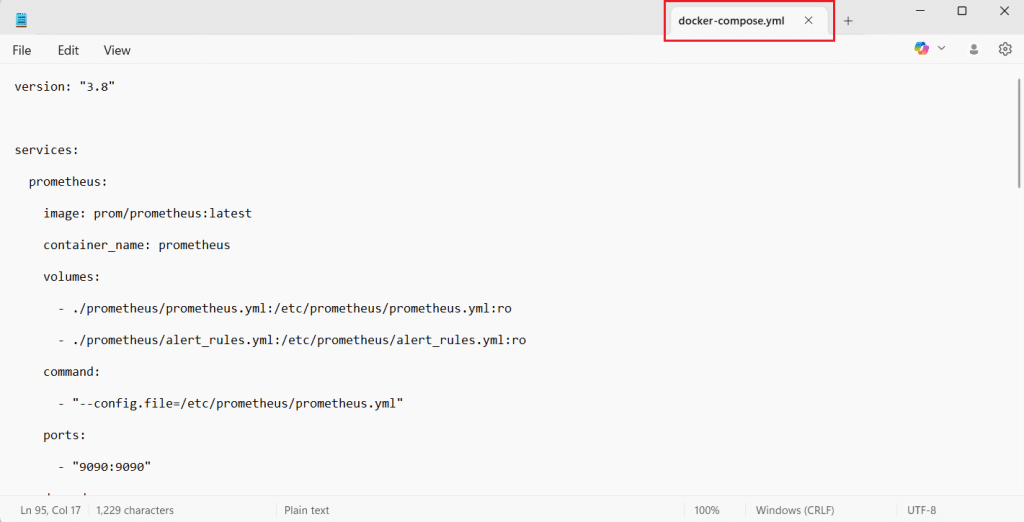
Open docker-compose.yml in a texteditor and paste the following:
version: "3.8"

services:
prometheus:
image: prom/prometheus:latest
container_name: prometheus
volumes:
- ./prometheus/prometheus.yml:/etc/prometheus/prometheus.yml:ro
- ./prometheus/alert_rules.yml:/etc/prometheus/alert_rules.yml:ro
command:
- "--config.file=/etc/prometheus/prometheus.yml"
ports:
- "9090:9090"
depends_on:
- node-exporter
- alertmanager

grafana:
image: grafana/grafana:latest
container_name: grafana
ports:
- "3000:3000"
environment:
- GF_SECURITY_ADMIN_USER=admin
- GF_SECURITY_ADMIN_PASSWORD=admin
volumes:
- grafana-data:/var/lib/grafana
depends_on:
- prometheus

node-exporter:
image: prom/node-exporter:latest
container_name: node-exporter
ports:
- "9100:9100"

alertmanager:
image: prom/alertmanager:latest
container_name: alertmanager
volumes:
- ./alertmanager/alertmanager.yml:/etc/alertmanager/alertmanager.yml:ro
command:
- "--config.file=/etc/alertmanager/alertmanager.yml"
ports:
      - "9093:9093"
volumes:
  grafana-data:
After saving the file, your docker-compose.yml should look similar to this:
This starts four containers:
- Prometheus for scraping and storing metrics
- Grafana for dashboards
- Node Exporter for Linux host metrics
- Alertmanager for receiving alerts
Step 3: Add Prometheus configuration
Open the file in a text editor, then paste the following content.
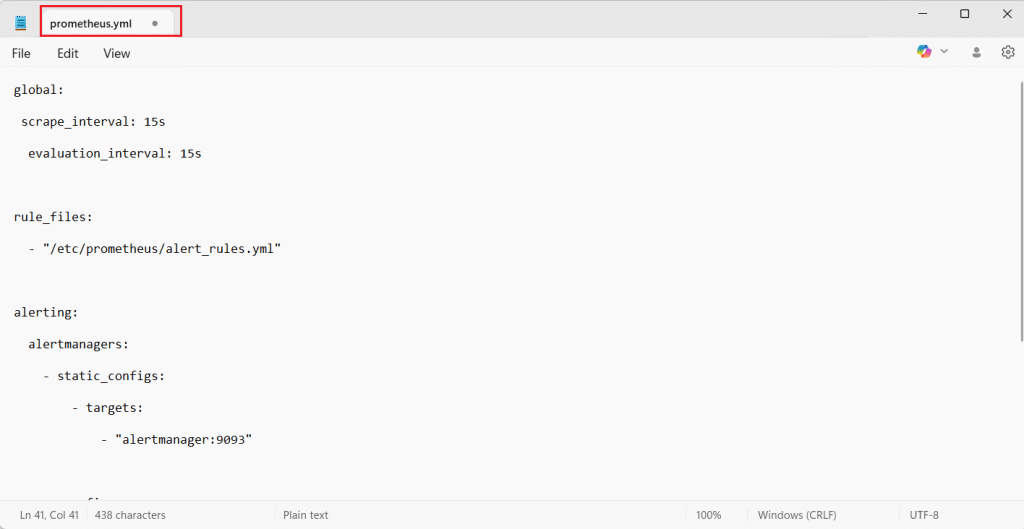
Open prometheus/prometheus.yml and add:
global:
scrape_interval: 15s
evaluation_interval: 15s

rule_files:
- "/etc/prometheus/alert_rules.yml"

alerting:
alertmanagers:
- static_configs:
- targets:
- "alertmanager:9093"

scrape_configs:
- job_name: "prometheus"
static_configs:
- targets: ["prometheus:9090"]

- job_name: "node"
static_configs:
- targets: ["node-exporter:9100"]
This tells Prometheus to scrape itself and Node Exporter, and to send alerts to Alertmanager.
Step 4: Add a basic alert rule
Open the file in a text editor, then paste the following content.
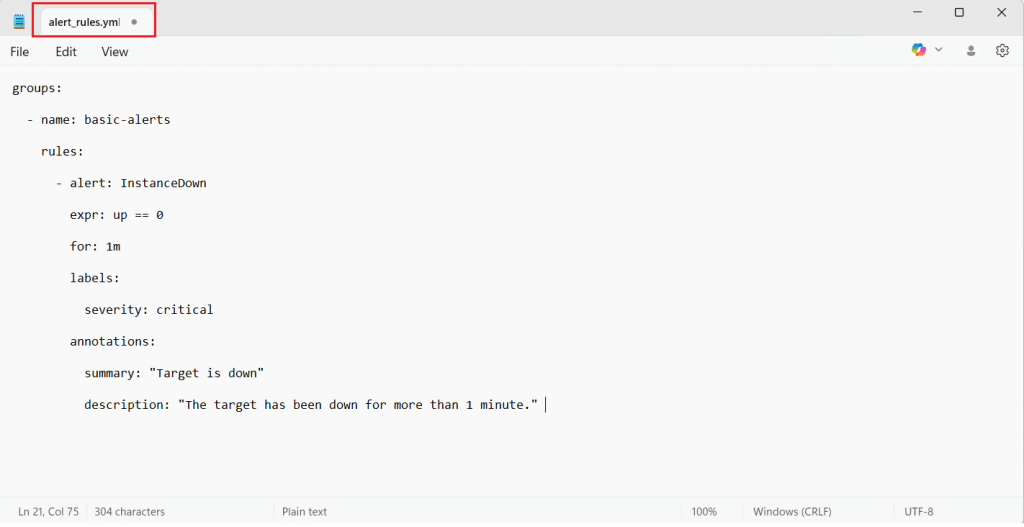
Open prometheus/alert_rules.yml and add this starter alert:
groups:
- name: basic-alerts
rules:
- alert: InstanceDown
expr: up == 0
for: 1m
labels:
severity: critical
annotations:
summary: "Target is down"
description: "The target has been down for more than 1 minute."
Step 5: Add Alertmanager configuration
Open the file in a text editor, then paste the following content.
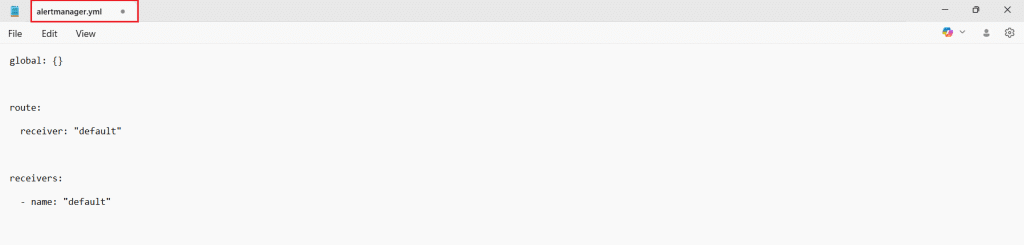
Open alertmanager/alertmanager.yml and add:
global: {}

route:
receiver: "default"

receivers:
- name: "default"
This is a minimal configuration so Alertmanager can receive and display alerts in its UI.
VPS note: If you are using a VPS, keep access secure. The simplest approach is SSH port forwarding, so you can use localhost URLs from your laptop browser.
Start the stack and verify Prometheus is collecting metrics
In this section, you will start all services using Docker Compose and confirm that Prometheus can successfully scrape metrics from Node Exporter.
Step 1: Start all containers
From the project folder (the one containing docker-compose.yml), run:
docker compose up -d
What this does:
- Downloads images (first run only)
- Starts Prometheus, Grafana, Node Exporter, and Alertmanager in the background
If everything is fine, the command will finish quickly and return you to the terminal prompt.
Step 2: Confirm containers are running
Run:
docker ps
You should see containers similar to:
- prometheus
- grafana
- node-exporter
- alertmanager
If you do not see one of them, check logs for that container:
docker logs <container_name>
Example:
docker logs prometheus
Step 3: Verify Prometheus targets are UP
Open Prometheus in your browser: http://localhost:9090
Now verify scraping:
- In the Prometheus UI, go to Status → Targets
- You should see at least two targets:
- prometheus (Prometheus scraping itself)
- node (Prometheus scraping Node Exporter)
- Both should show State: UP
If a target is DOWN, the page usually shows the error reason. The most common causes are:
- Wrong target name in prometheus.yml
- Containers not on the same Docker network (rare with Compose)
- A config file typo that prevented Prometheus from loading correctly
Step 4: Verify Node Exporter is exposing raw metrics
Open Node Exporter’s metrics endpoint:
You will see a plain text output. It is not meant to look friendly. It will contain many lines and comments.
Here are examples of what you might see:
# HELP node_memory_MemAvailable_bytes Memory information field MemAvailable_bytes.
# TYPE node_memory_MemAvailable_bytes gauge
node_memory_MemAvailable_bytes 8.392384512e+09

# HELP node_cpu_seconds_total Seconds the CPUs spent in each mode.
# TYPE node_cpu_seconds_total counter
node_cpu_seconds_total{cpu="0",mode="idle"} 12345.67
node_cpu_seconds_total{cpu="0",mode="user"} 234.56
This confirms Node Exporter is working and exposing host metrics for Prometheus.
Step 5: Run a quick query in Prometheus
Go back to Prometheus:
In the top query box, run:
up
Click Execute.
Expected result:
- You should see values like 1 for targets that are reachable.
- If Node Exporter is reachable, up{job=”node”,…} should be 1.
- If Prometheus is reachable, up{job=”prometheus”,…} should also be 1.
If you want one more useful check, try:
scrape_duration_seconds
This shows how long scraping takes per target.
At this stage, your monitoring stack is running and Prometheus is successfully collecting metrics. Next, we will connect Grafana to Prometheus and build a first dashboard view.
Set up Grafana and view metrics from Prometheus
Now that Prometheus is scraping metrics, the next step is to connect Grafana to Prometheus so you can view metrics in a readable dashboard format.
Step 1: Open Grafana and log in
Open Grafana in your browser:
On first login, Grafana will ask for credentials. If you used the Docker Compose file from earlier sections, the default is:
- Username: admin
- Password: admin
Grafana may prompt you to change the password after the first login. You can set a new password or skip for now if you are only testing locally.
Step 2: Add Prometheus as a data source
Grafana needs to know where Prometheus is running.
-
- In Grafana, open Connections (or Data sources, depending on UI version)
- Click Add data source
- Select Prometheus
- In the Prometheus URL field, enter:
Important: Use prometheus:9090 (not localhost:9090) because Grafana runs inside a container and must reach Prometheus over the Docker network.
- Click Save and test
If the connection is successful, Grafana will show a confirmation message that the data source is working.
If you see an error:
- Recheck that Prometheus container is running (docker ps)
- Ensure you used http://prometheus:9090 in Grafana
- Check Prometheus logs (docker logs prometheus) for config errors
Step 3: Create a simple dashboard panel (quick verification)
Instead of importing a big dashboard immediately, start with one simple panel so you know everything works end to end.
- In Grafana, go to Dashboards
- Click New → New dashboard
- Click Add visualization
- Select the Prometheus data source you just added
- In the query box, enter:
up
- Run the query (Grafana will show a preview)
- You should see one line per target. Values should be 1 if targets are reachable.
Click Apply to save the panel.
This verifies:
- Grafana can query Prometheus
- Prometheus has data
- Your scrape targets are reachable
Step 4: Make the panel more meaningful (optional)
The up metric is useful, but a system metric is more interesting. If you are using Node Exporter, try a memory query:
node_memory_MemAvailable_bytes
This will display available memory in bytes. You can later format it to GB in Grafana panel options, but even raw numbers confirm the data flow is working.
Another useful option is CPU load:
node_load1
This shows the 1-minute load average.
Step 5: Import a ready-made dashboard (optional, but common)
If you want a full server dashboard without building everything manually, import a Node Exporter dashboard.
- Go to Dashboards
- Click New → Import
- Search for a Node Exporter dashboard in Grafana’s dashboard library, or use a known community dashboard such as “Node Exporter Full”
- Select your Prometheus data source when prompted
- Import and review panels for CPU, memory, disk, and network
This step is optional, but it is a fast way to get a complete monitoring view.
At this point, Prometheus is collecting metrics and Grafana is successfully visualizing them. Next, we will connect alerting end to end by confirming Prometheus alert rules and verifying that Alertmanager receives firing alerts.
Metrics concept (brief and practical)
Metrics are numeric measurements collected repeatedly over time. Instead of storing detailed event text like logs, metrics store numbers that help you understand trends and system health.
Examples of metrics you might track:
- CPU usage percentage
- Available memory in bytes
- Disk free space
- Total number of HTTP requests
- Response time for requests
Prometheus stores metrics as time series data. Each metric typically has:
- A metric name (example: up)
- A numeric value (example: 1)
- Optional labels that add context (example: instance=”server1:9100″)
A simplified example of what a metric can look like:
up{job="node",instance="localhost:9100"} 1
This means the target localhost:9100 is reachable right now. Over time, Prometheus keeps collecting these values, which makes it possible to visualize patterns in Grafana and create alerts when values cross thresholds.
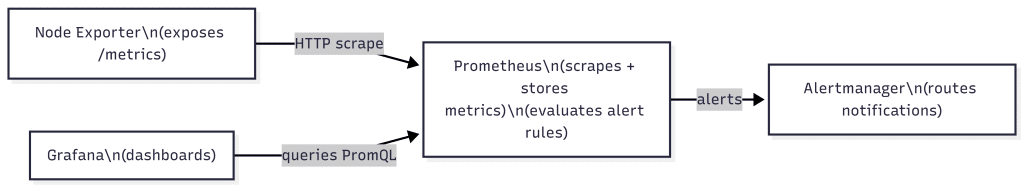
How Prometheus, Grafana, Node Exporter, and the /metrics endpoint work together
To monitor a machine or application, you need a source that exposes metrics, a collector that stores them, and a dashboard to visualize them.
Node Exporter is a small service that runs on a Linux machine and exposes host metrics such as CPU, memory, disk, and network. It publishes these metrics on an HTTP endpoint, usually:
This endpoint is often called the metrics endpoint or metrics page. It is not a normal website for humans. It shows machine-readable text that Prometheus can scrape.
Prometheus is configured with a list of targets (endpoints) to scrape. At a fixed interval (for example every 15 seconds), Prometheus calls the /metrics endpoint, reads the metric values, and stores them as time series data. Prometheus can also evaluate alert rules and send firing alerts to Alertmanager.
Grafana is the visualization layer. Grafana connects to Prometheus as a data source, queries the stored metrics, and displays them as dashboards, charts, and panels. In simple terms, Prometheus stores the truth, and Grafana helps you explore and understand it.
A quick flow view looks like this:
Node Exporter (exposes metrics at /metrics) → Prometheus (scrapes and stores metrics, evaluates alerts) → Grafana (visualizes metrics in dashboards)
up{job="node",instance="localhost:9100"} 1
Basic alerting example (Prometheus rules + Alertmanager)
In this section, we will confirm that Prometheus is loading your alert rule, then verify that Alertmanager is receiving alerts from Prometheus. We will use a simple “target down” alert because it is easy to test and understand.
Step 1: Confirm Prometheus loaded the alert rule
Open Prometheus:
Go to Status → Rules.
What you should see:
- A rule group named basic-alerts
- An alert named InstanceDown
If you do not see the rule:
- Recheck the rule_files section in prometheus.yml
- Confirm the alert rules file path matches: /etc/prometheus/alert_rules.yml
- If you edited files after containers started, restart Prometheus so it reloads config:
docker compose restart prometheus
Step 2: Confirm Prometheus can talk to Alertmanager
In Prometheus, go to Status → Configuration and look for the alerting block. You should see Alertmanager listed with this target:
- alertmanager:9093
This confirms that Prometheus is configured to send alerts to Alertmanager.
If you want a direct check from Prometheus side:
- Go to Status → Targets
- Look for an “Alertmanagers” section (UI varies by version)
- Ensure Alertmanager is shown as reachable
Step 3: Trigger the alert (simple test)
The InstanceDown alert fires when a scrape target becomes unreachable for more than 1 minute. The easiest way to trigger it is to stop Node Exporter:
docker stop node-exporter
Wait a little over 1 minute.
Now open Prometheus Alerts:
What you should see:
- InstanceDown becomes active or firing
- It should mention the target instance for the node job
Step 4: Confirm Alertmanager receives the alert
Open Alertmanager:
What you should see:
- An alert group containing InstanceDown
- Status should show as firing
This confirms the full alert flow:
Prometheus evaluates rules → fires alert → sends to Alertmanager → Alertmanager displays it.
Step 5: Recover the target
Restart Node Exporter:
docker start node-exporter
After a short time, Prometheus should mark the target as UP again and the alert will resolve.
VPS note: If you run this later on a server and you are using SSH port forwarding, the same URLs (localhost:9090, localhost:9093) still work from your laptop browser.
Conclusion and next steps
You have now set up a complete monitoring stack using Docker Compose:
- Node Exporter exposes Linux host metrics on a /metrics endpoint
- Prometheus scrapes those metrics, stores them as time series data, and evaluates alert rules
- Grafana connects to Prometheus and visualizes metrics using dashboards
- Alertmanager receives alerts fired by Prometheus and groups them for notification delivery
At this stage, you can already monitor basic server health, validate service availability using the up metric, and confirm alerting works end to end using the InstanceDown rule. Next steps to make this production-ready:
- Secure Grafana (change default credentials, restrict access)
- Add persistence for Prometheus data so metrics remain available after restarts
- Add more alert rules (high CPU, low disk space, high memory usage)
- Start monitoring applications and databases by exposing application metrics or using exporters
- Configure Alertmanager notifications (email, Slack, or webhooks) so alerts reach the right team
This setup is a strong foundation you can reuse across local environments, VPS deployments, and larger infrastructure as your monitoring needs grow.