


CPU spikes can cause slowdowns or timeouts on your cloud server. In this guide, we’ll walk through how to monitor CPU spikes on Kamatera servers. This guide helps you troubleshoot your CPU spikes on an existing server by running a standard set of SSH commands to identify the cause and collect diagnostics for support if needed. Once the server is up, you can connect over SSH and run a standard set of tools to quickly identify what is driving CPU spikes.
Prerequisites:
- A running Kamatera server where CPU spikes are observed
- SSH access to the server (root or a sudo user)
- Permission to run basic Linux monitoring commands
Kamatera quick check (UI)
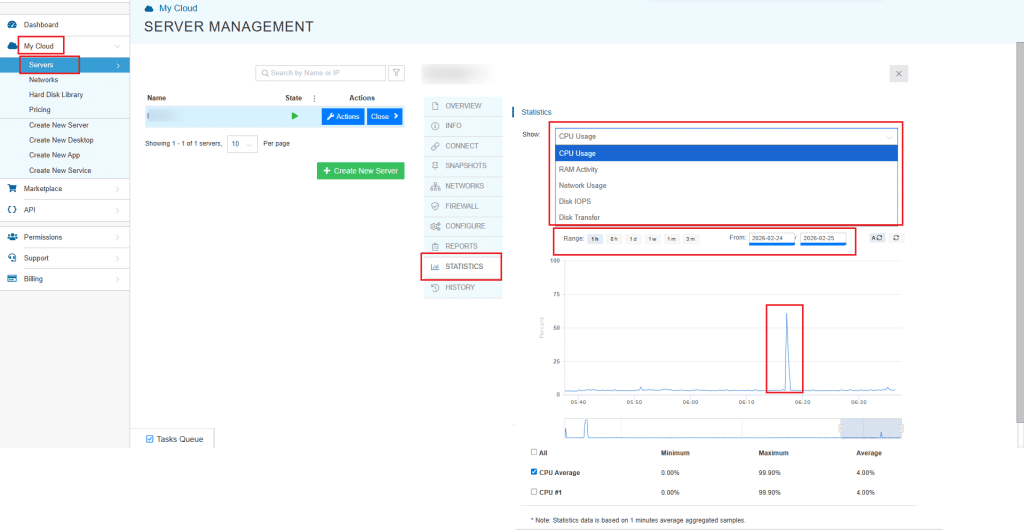
Kamatera allows you to check the statistics. In the Kamatera console, open the server and go to Statistics → CPU Usage to confirm when the spike happened and how high it reached. You can apply different filters of date and time range, check CPU, RAM, network, and disk activity.
Quick triage
1. Check load and uptime:
uptime
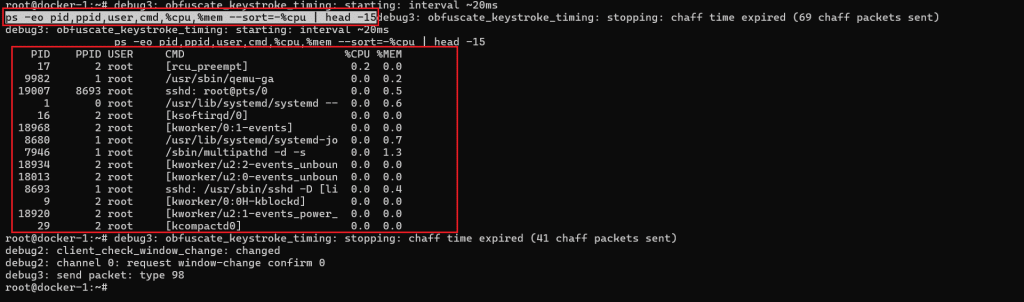
2. See the top CPU consumers right now:
ps -eo pid,ppid,user,cmd,%cpu,%mem --sort=-%cpu | head -15
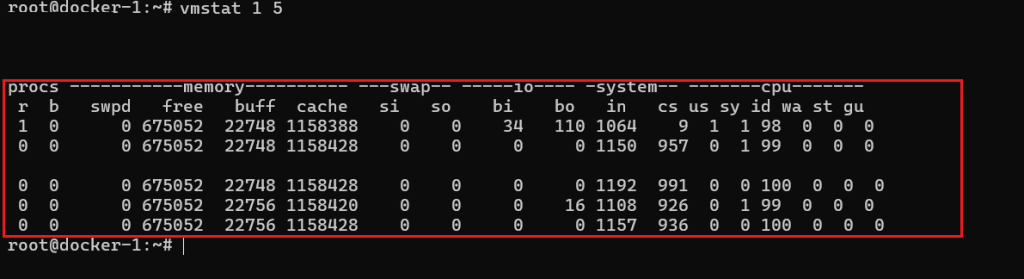
3. See if CPU is truly busy or if the system is waiting on I/O:
vmstat 1 5
How to read the results:
- If %cpu is high for one process in the ps output, that process is your starting point.
- In vmstat, if wa (I/O wait) is high, the spike may be storage related rather than pure CPU.
- If r (run queue) stays high and id (idle) is low, the CPU is under real pressure.
Save the outputs of these commands, they will be useful for troubleshooting later.
Before you begin
- These steps assume an Ubuntu server.
- Run commands as a user with sudo privileges.
- If a command is missing, install the tools in Step 1.
Step 1: Install basic troubleshooting tools
Run:
sudo apt-get update
sudo apt-get install -y procps sysstat iotop htop
sudo systemctl enable --now sysstat
Verify tools are working:
uptime
sar -u 1 3
If sar is not found or there are errors:
sudo systemctl enable --now sysstat
Step 2: Capture a quick baseline (load + CPU cores)
Check current load:
uptime
Check CPU cores:
nproc
What to note:
- Load average vs CPU core count
- If load stays higher than cores for several minutes, you likely have sustained pressure (CPU or I/O wait)
Step 3: Find the process causing the CPU spike
Snapshot top CPU consumers:
ps -eo pid,ppid,cmd,%cpu,%mem --sort=-%cpu | head -n 15
Real time view:
top -o %CPU
In top:
- Press 1 to see per-core usage
- Press H to include threads (useful for Java, databases, and multi-threaded apps)
What to note:
- PID, process name, and whether it stays at high CPU or just bursts
Step 4: Check if it’s CPU work or disk I/O wait
CPU breakdown over a few seconds:
sar -u 1 5
How to read it:
- High %usr or %sys means real CPU usage
- High %iowait suggests the server is waiting on disk, which often feels like a CPU problem
If iowait looks high, confirm disk activity:
sudo iotop -o

What to note:
- The process doing heavy I/O and whether it lines up with the CPU spike window
Step 5: Check memory pressure (swapping can cause spikes and slowness)
Memory status:
free -h
Check swapping activity:
vmstat 1 5
How to read it:
- If si and so are consistently above 0 during slowness, the server is swapping
- Swapping often causes latency spikes and unstable CPU behavior
Step 6: Check if the spike is sustained or periodic
Sample CPU once per minute (10 minutes):
sar -u 60 10
If history is available, view broader CPU stats:
sar -u
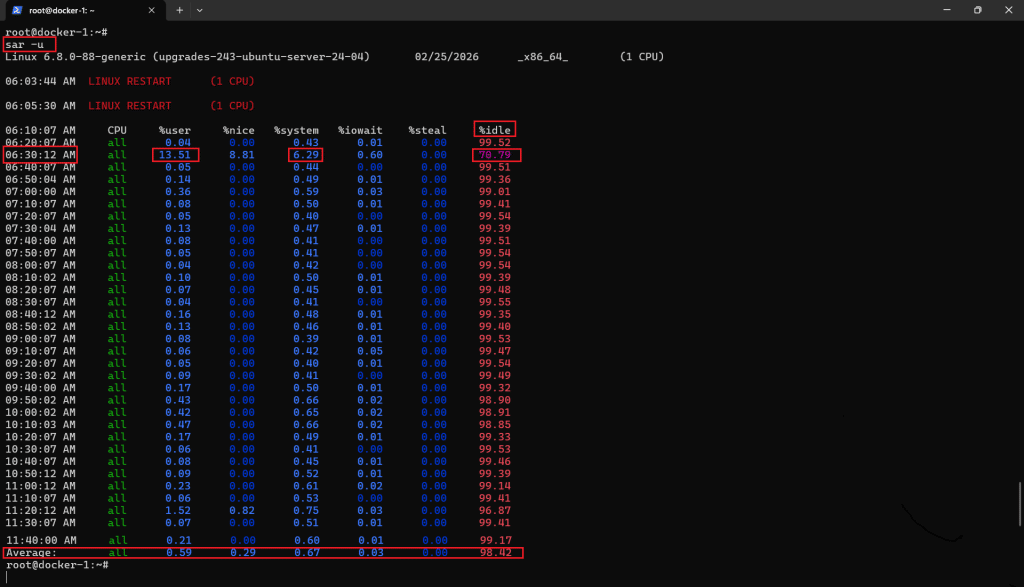
Notice the drop in %idle and rise in %user at 06:30, indicating a short CPU spike driven by user processes.
What to note:
- Whether spikes correlate to a schedule (hourly, nightly, specific minutes)
Step 7: Check service logs for clues (optional)
Skip this step if you already identified the culprit process and just need diagnostics output for support.
List running services:
systemctl --type=service --state=running
Check logs for a specific service (use the service name you suspect):
journalctl -u <service-name> --since "30 min ago" --no-pager | tail -n 200
What to look for:
- Restarts, crashes, repeated errors, or spikes tied to a job or request surge
Step 8: Safe quick actions support can suggest
If a single service is clearly responsible and the customer accepts a restart:
sudo systemctl restart <service-name>
sudo systemctl status <service-name> --no-pager
Check for scheduled jobs that may trigger spikes:
crontab -l
sudo crontab -l
ls -la /etc/cron.*
If spikes align with background updates:
grep -iE "upgrade|install|unattended" /var/log/dpkg.log | tail -n 50
Step 9: Collect a diagnostics bundle for support
Ask the customer to run and paste the output:
date
uptime
nproc
free -h
vmstat 1 5
ps -eo pid,ppid,cmd,%cpu,%mem --sort=-%cpu | head -n 15
sar -u 1 5
If disk I/O is suspected:
df -h
sudo iotop -o -b -n 5
Step 10: Decide next action (optimize or scale)
Use these signals to choose the next step:
If CPU is the bottleneck:
- %usr / %sys stays high and %idle stays low during normal traffic
- A known workload process is consistently top CPU
Action:
- Tune the application or increase vCPU
If memory is the bottleneck:
- Swap usage is present, vmstat shows si/so activity
Action:
- Reduce memory usage or increase RAM
If disk I/O is the bottleneck:
- %iowait is high, iotop shows heavy read/write
Action:
- Improve disk performance, reduce I/O heavy operations, or move to faster storage
Conclusion
CPU spikes on a Kamatera Ubuntu server usually come down to one of three causes: a specific process consuming CPU, the system waiting on disk I/O, or memory pressure leading to swapping. By following the steps in this guide, you can quickly confirm which condition is driving the slowdown, capture the key evidence, and take a safe next action, such as restarting an affected service or adjusting resources. If the issue persists, share the diagnostics bundle output along with the time window of the spike and the impacted workload so support can pinpoint the root cause faster.