


In this guide, we’ll walk through installing Netdata on a Linux server (Ubuntu Server 24.04), the officially supported platform for hosting the full Netdata dashboard.
If you’re using a Windows machine, you can still follow along by setting up a virtual Ubuntu server using VirtualBox. This simulates a VPS environment and lets you capture the same real-time monitoring experience perfect for development, testing, or learning before moving to the cloud.
This guide was written and tested using a VM via Kamatera. (Read How to Deploy a Kamatera Server)
To follow along on Kamatera:
- Log into your Kamatera Portal
- Create a new server with Ubuntu (minimum 1 vCPU, 1 GB RAM)
- SSH into your server and follow the same installation steps listed in this article
Kamatera offers full root access, so all commands and network configuration steps (like UFW, Netdata bind address, and port 19999 access) work the same way.
Here are the steps to install Netdata for real-time monitoring.
Step 1: Log in to the Kamatera cloud console
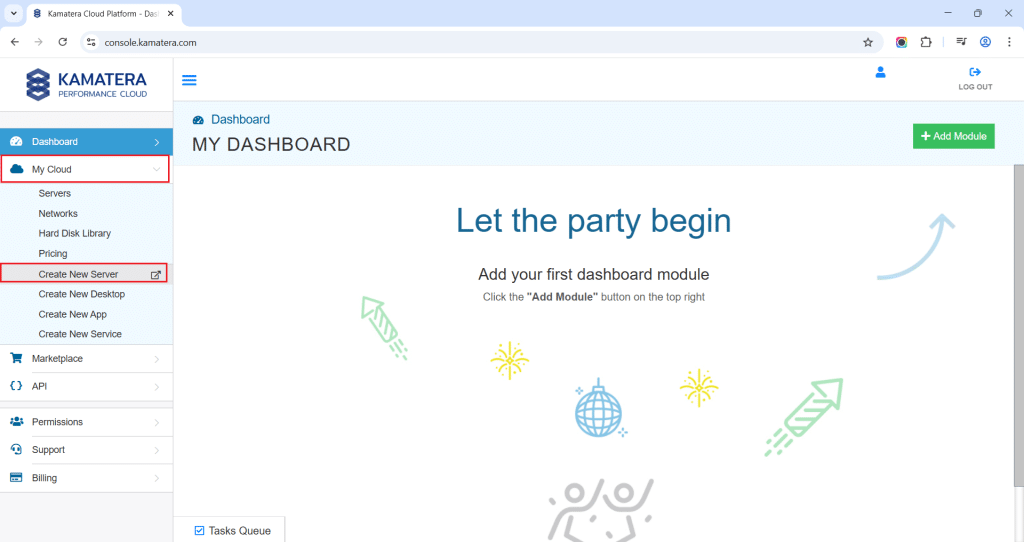
The very first step in deploying Netdata on Kamatera is to log in to your Kamatera Cloud Management Console.
Step 2: Configure your server
Once logged in you will be presented with the dashboard. This is where you’ll manage servers, networking, and storage.
- Expand the My Cloud option on the right bar and choose Create New server.
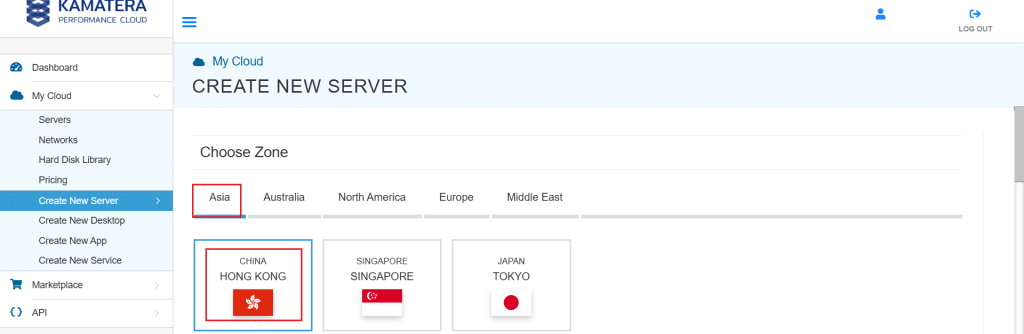
2. Under create new server option, choose Zone.
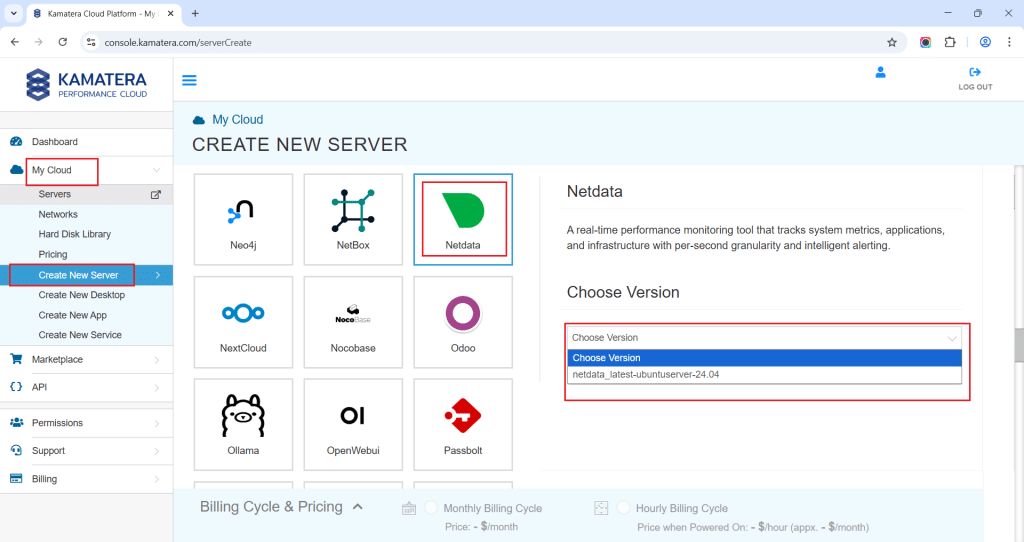
3. Scroll down and under the App Images tab look for the Netdata option. Once selected, choose the version associated with the app image.
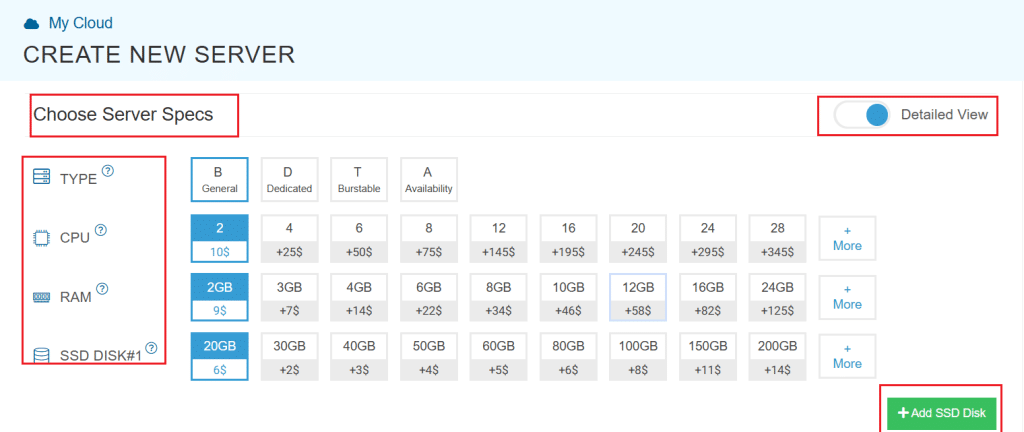
4. Once you choose the version, scroll down, and enable the Detailed View toggle and input the server Specifications.
5. Choose the Type, CPU, RAM, and Disk storage that you need. Click on the help button to learn more about the settings. You can add more disk storage at any time.
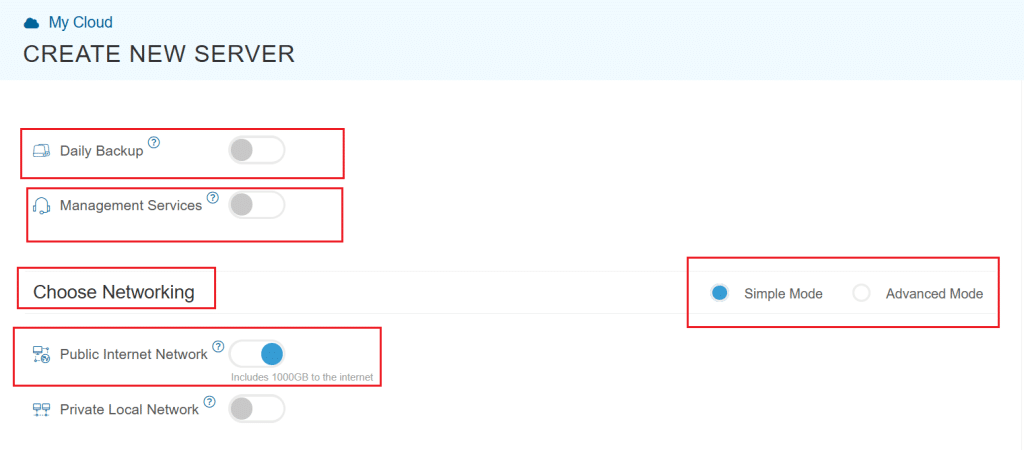
6. Enable the Daily backup option if you need a daily backup of your server storage.
7. Enable the Management services toggle to have your server managed by Kamatera’s professional services support team.
8. Choose Networking option, either simple or advanced mode. This section lets you define how your server will connect to the internet and how much outbound data it can use per month.
- Simple Mode – Choose between WAN or LAN.
- Advanced Mode – NIC #1 (Network Interface Card)
-
- WAN (selected): This means your server will be accessible from the internet. It will get a public IP.
- The other options (LAN, Private, etc.) are only needed for internal or isolated setups, which are not relevant for a public-facing Netdata instance.
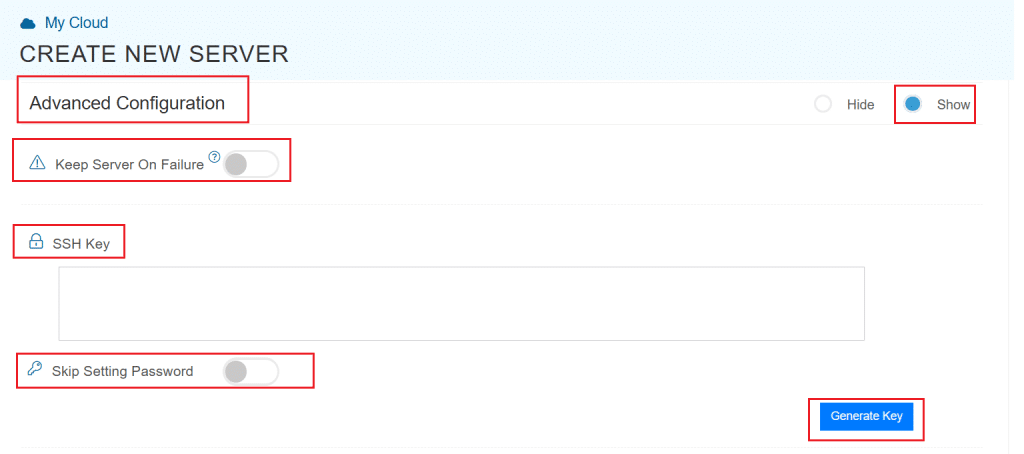
9. Proceed for Advanced Configuration if required.
- Keep Server On Failure: This option controls what happens if something goes wrong while setting up your server. For example, if a startup script fails. If this setting is OFF (the default), Kamatera will automatically delete the server if the setup fails. This setting is useful if you want to avoid paying for a broken setup, but you won’t be able to debug what went wrong. If this setting is ON, Kamatera will keep the server running, even if something fails during the initial setup. This lets you log in, investigate the issue, fix problems manually, and retry setup if needed.
Recommended for most users:
Keep it OFF unless you’re running custom scripts or complex configurations. For basic setups like Netdata, the default (OFF) is usually fine.
- SSH key: Allows you to securely connect to the server without a password (recommended for better security).
- Skip Setting Password: If enabled, your server will only allow SSH key login—no password access.
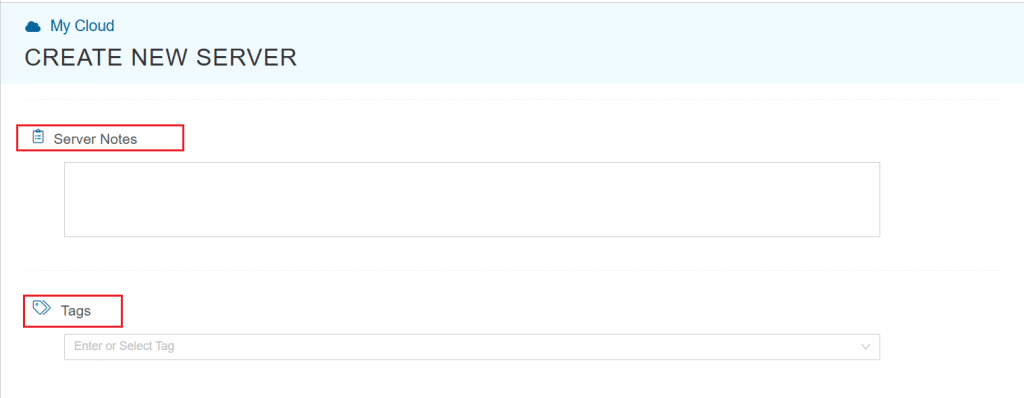
You can click “Generate Key” if you don’t already have one. Input further server notes and tags if necessary.
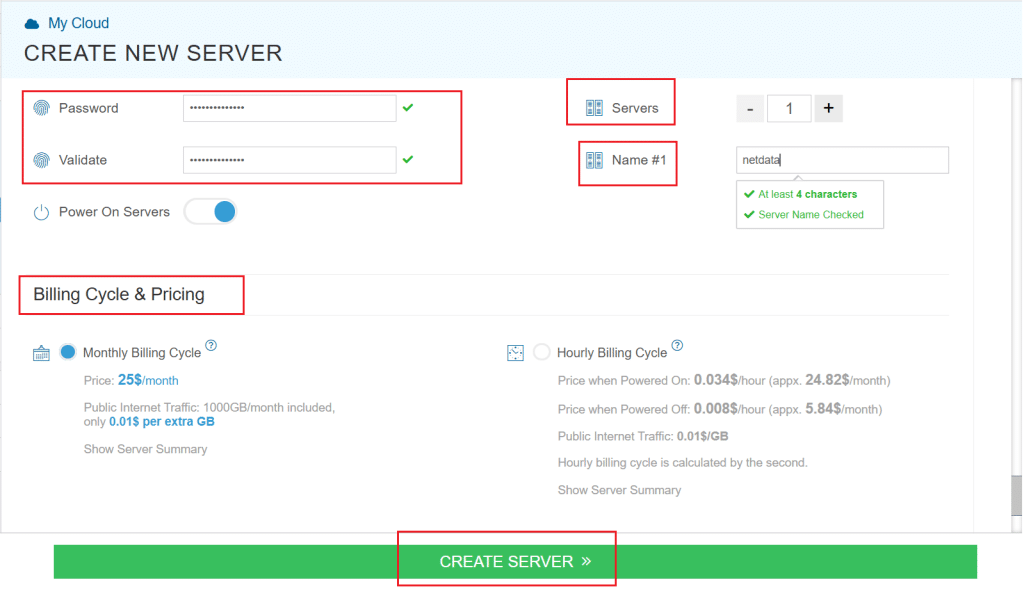
10. Finally, choose a strong password, select the number of servers, and input a server name.
11. Once all details are inputted, choose billing cycle and click on Create server button.
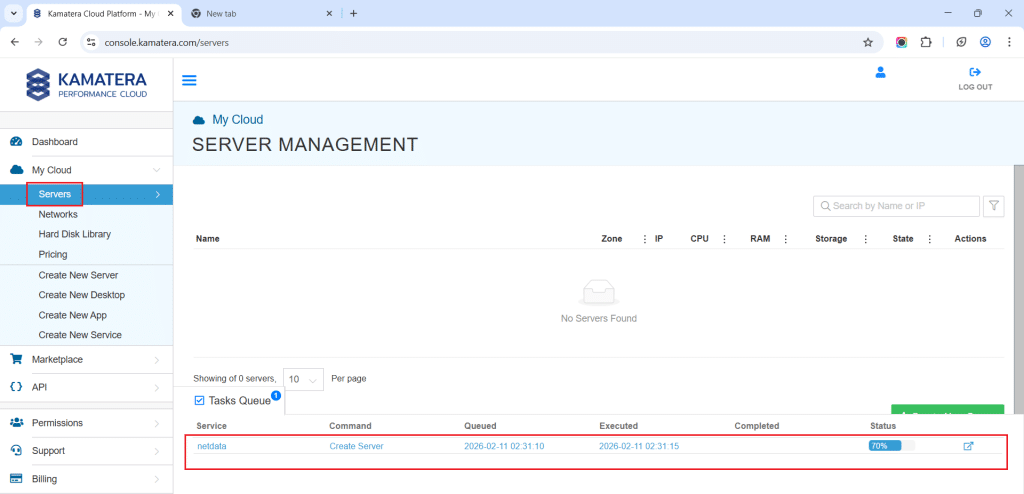
You can check the server creation progress under Server > Task Queue.
Once created, the server will be visible under same Servers panel.
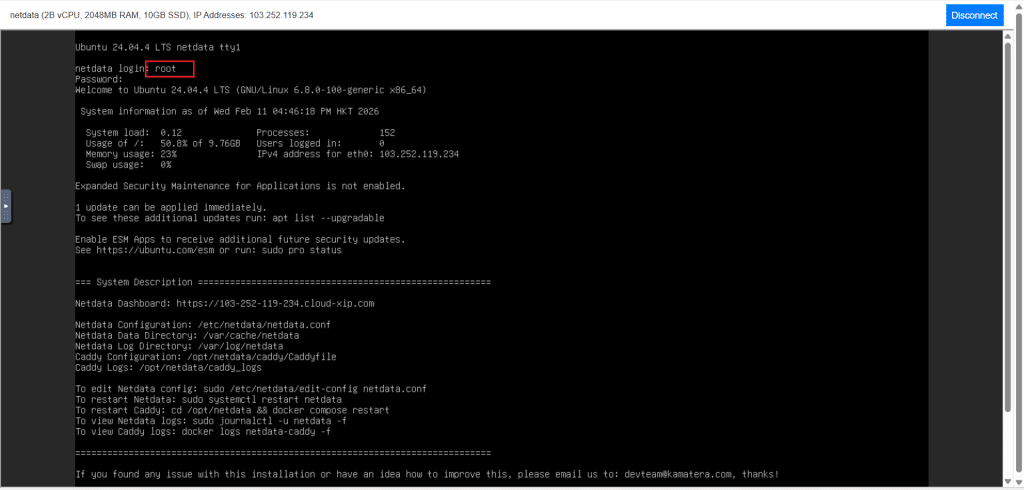
To open the remote server, click on Connect and Open Remote Console. It will open the remote machine in a separate window where the user can access the console of the remote machine, as well. To disconnect the remote server, click Disconnect, which will disconnect the remote session.
Once connected, user needs to login with the user id (root) and password set up before. Once you enter the user id, press enter and then enter password. Remember, here you will not see any inputs—not even (*) symbol on the screen while entering the password as a security measure, so carefully input the password and press enter.
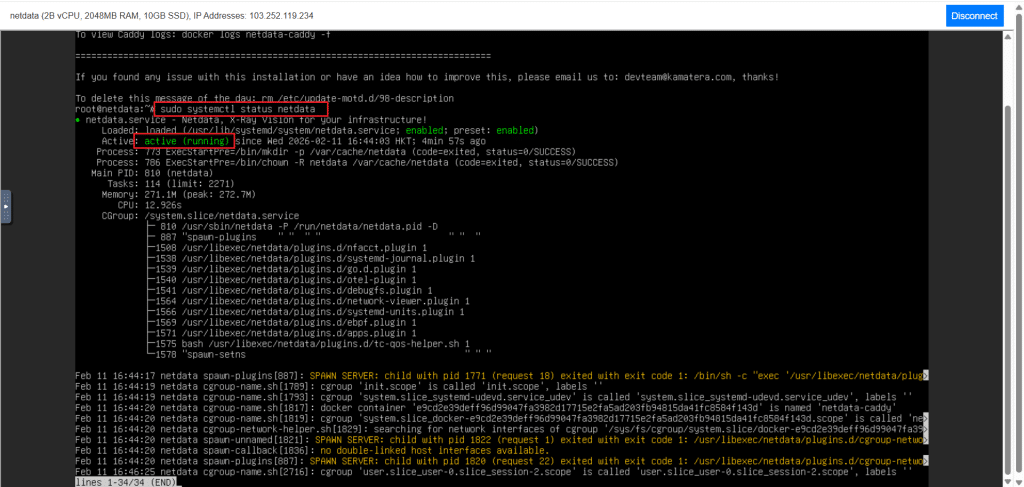
After login, check if the Netdata is running with the below command. If the output is “active,” then it has been successfully installed and started.
Command:
sudo systemctl status netdata
Access Netdata dashboard in browser
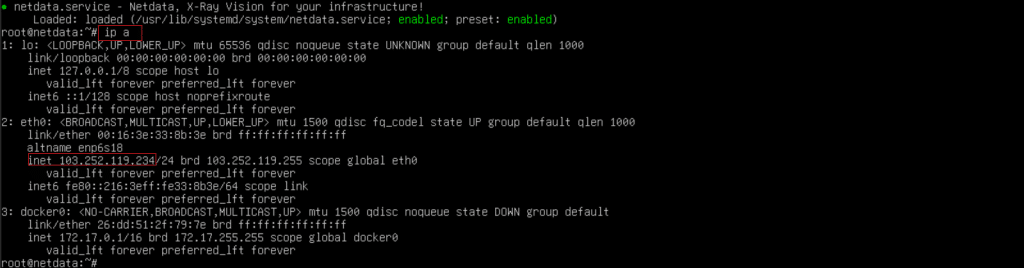
Once the installation is complete and the Netdata service is running, you can access the real-time monitoring interface through your web browser. First, retrieve your server’s IP address by running:
Command: (Note the IP address — for example: 103.252.119.234)
ip a
Look for the IP listed under your active network interface (e.g., enp0s3). Then, open any browser on your main laptop. In the address bar, type: http://103.252.119.234:19999/
If the browser shows a Netdata dashboard, you’re done with local access.
But if the page doesn’t load, confirm Netdata is listening on port 19999.
Run:
sudo ss -lntp | grep 19999 || sudo netstat -lntp | grep 19999
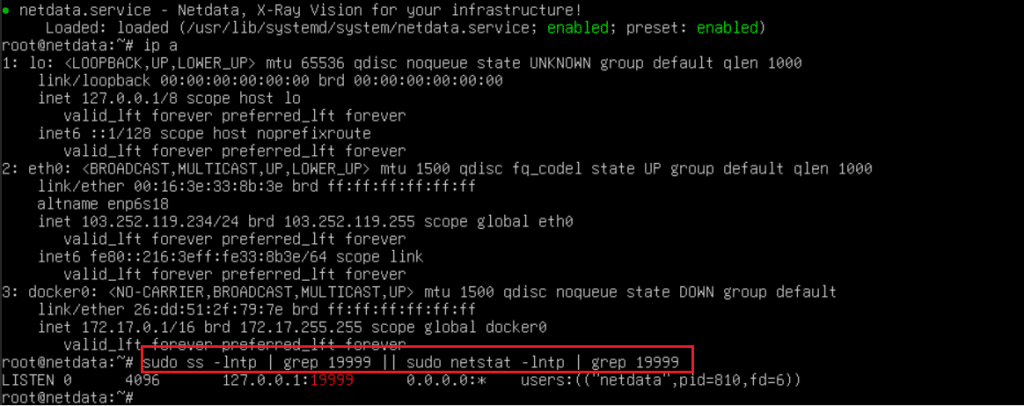
The above output says Netdata is listening on:
127.0.0.1:19999
That means Netdata is bound to localhost only, so it will work only inside the VM, and your browser from outside will never reach it. Make it listen on all IPs, then open the port.
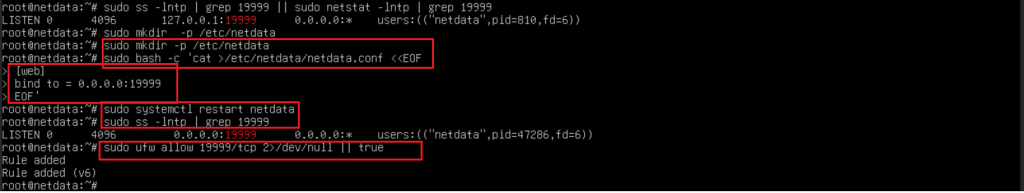
Copy and run these commands in the VM, in this exact order:
sudo mkdir -p /etc/netdata

sudo bash -c 'cat >/etc/netdata/netdata.conf <<EOF

[web]

bind to = 0.0.0.0:19999

EOF'

sudo systemctl restart netdata

sudo ss -lntp | grep 19999
Now allow the port (Ubuntu most likely):
sudo ufw allow 19999/tcp 2>/dev/null || true
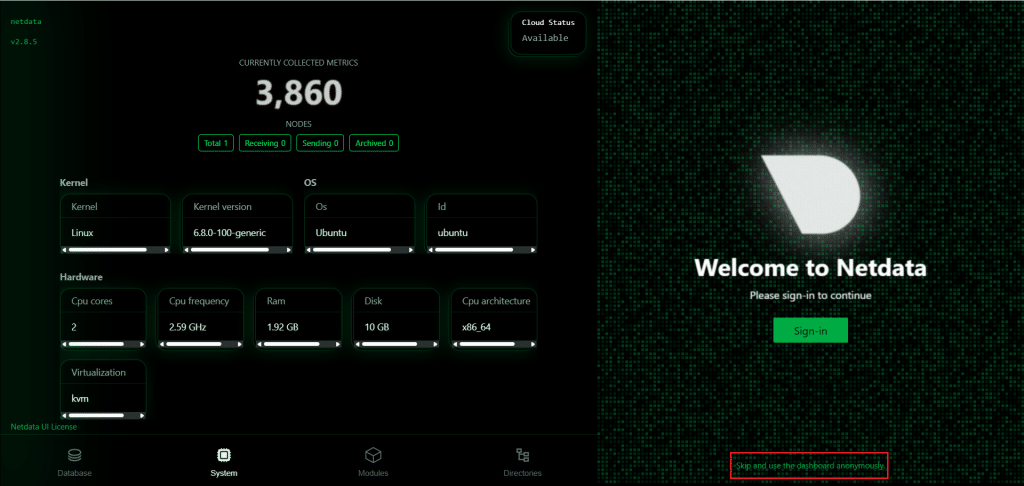
Then open in your browser, browse the link. You should see the Netdata welcome screen. It offers two options:
- Use it without login
Click the small link at the bottom right: “Skip and use the dashboard anonymously”. - Sign in (optional)
Click Sign-in only if you want to connect it to Netdata Cloud.
The Netdata dashboard looks like this:
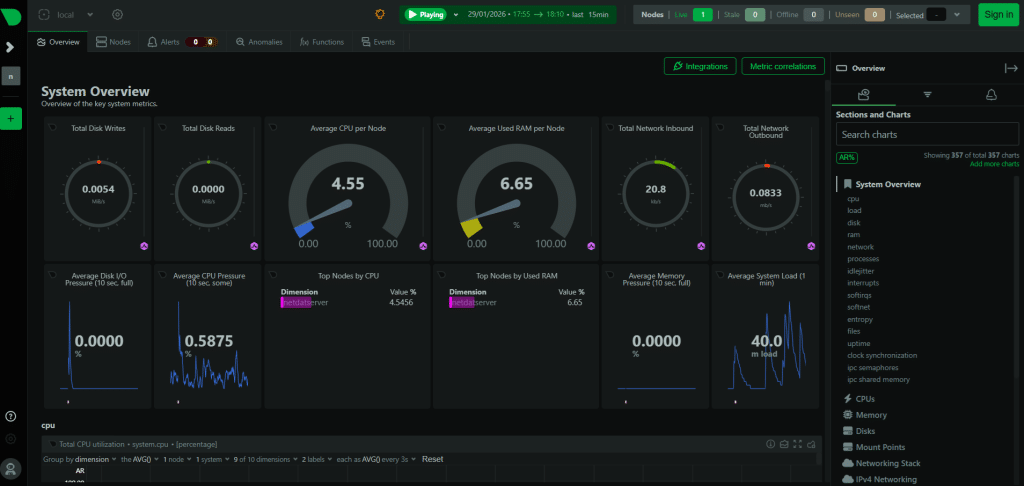
Once the Netdata dashboard loads (at http://<your-VM-IP>:19999), you’re greeted with an overview of critical system metrics in real time. Unlike traditional monitoring tools that poll data every few seconds or minutes, Netdata streams metrics with sub-second granularity — perfect for detecting spikes, latency, and transient issues. The main dashboard displays:
- CPU usage (with pressure and load metrics)
- RAM usage per node
- Disk I/O and network throughput
- System load and alert status
You’ll also see graphs update live without refresh, helping you catch anomalies instantly.
Local vs centralized Netdata
Once the Netdata dashboard is accessible via http://<your-ip>:19999, your server is running in local monitoring mode, which is ideal for single-node setups. This mode enables real-time visibility into system metrics such as CPU usage, memory consumption, disk I/O, and network activity—without requiring any user login or cloud integration.
Local Netdata is lightweight, fast, and perfect for developers or system admins who want instant, browser-based insights into their machine’s performance. However, this mode lacks features like multi-node monitoring, long-term historical data, and alerting capabilities. For those needs, Netdata Cloud offers a centralized dashboard where multiple nodes can be linked and managed from one interface, along with enhanced analytics, anomaly detection, and alerting features. In this article, we’ll focus only on local monitoring, as it’s simple to set up and meets the needs of most users looking for quick server diagnostics.
Securing your Netdata setup: Bind address and access control
By default, Netdata is configured to listen only on 127.0.0.1 (localhost), which means it’s not accessible externally. In this setup, we changed the bind address to 0.0.0.0 so the dashboard could be accessed from the host machine or other devices on the same network. While this is useful for local testing or internal LAN monitoring, it’s important to consider the security implications.
Step 1: Use a Firewall
Ensure your system firewall (like ufw) is active and only allowing the required port:
sudo ufw allow 19999

sudo ufw enable
This ensures only port 19999 is open for Netdata, blocking unnecessary access.
Step 2: Avoid exposing Netdata publicly
Do not expose your Netdata server to the internet, unless absolutely required. If you must, it’s recommended to:
- Set up a reverse proxy like NGINX, with basic authentication
- Use fail2ban or rate-limiting to prevent brute-force attempts
- Bind Netdata to a private IP or specific interface only
Step 3: Use access controls
For advanced setups, you can enable authentication by configuring:
/etc/netdata/basic-auth.conf
This file allows you to define usernames and hashed passwords to restrict access to the dashboard.
Netdata vs Prometheus
While Netdata is excellent for real-time, out-of-the-box monitoring, many teams also consider Prometheus for observability needs. The two tools serve different purposes. Netdata focuses on instant, per-second updates with zero setup, making it ideal for spotting performance anomalies quickly on individual servers. It offers a rich dashboard the moment you install it—no database, no frontend configuration, no exporters.
Prometheus, on the other hand, is built for long-term metric storage and custom querying. It uses a pull-based model, scraping metrics from targets at regular intervals and storing them in a time-series database. It’s often used alongside Grafana for visualization, offering flexible dashboards and custom alerts but requiring significantly more setup. In short, If you need real-time monitoring on a single node or small fleet, Netdata is the easiest and fastest option. If your goal is scalable monitoring with deep integration and alerting, Prometheus is the better fit.
Conclusion
Netdata is one of the easiest monitoring solutions to set up, offering real-time insights within minutes of installation. Whether you’re a solo developer, a small team, or a startup managing just a few servers, its low setup effort and powerful dashboard make it a practical choice.