


Kamatera provides flexible cloud infrastructure where you can quickly spin up virtual machines with your preferred server OS images, such as Ubuntu. On top of this infrastructure, you can deploy lightweight Kubernetes distributions to manage containerized applications. In this guide, we’ll use MicroK8s, a minimal, fast, and production-ready Kubernetes distribution maintained by Canonical, to set up a Kubernetes cluster and install the Kubernetes dashboard.
The Kubernetes dashboard is a web-based UI that makes it easier to monitor and manage workloads, cluster resources, and troubleshooting tasks. By combining Kamatera’s reliable cloud VMs with MicroK8s, you get a simple yet powerful way to run Kubernetes and manage it visually through the dashboard.
Understanding Kubernetes node types
In a Kubernetes cluster, there are two main types of nodes:
- Master node (control plane): This is the brain of the cluster. It manages the overall state, schedules applications (pods) on worker nodes, and handles scaling, updates, and monitoring.
- Worker nodes: These are the machines where applications actually run. Each worker node hosts the pods, along with the necessary runtime and services, and reports back to the master node.
For this guide, we’ll use Ubuntu 22.04 (a Server OS image provided by Kamatera Cloud Platform) on both the master node and worker nodes to set up a MicroK8s cluster and install the Kubernetes dashboard.
Setting up the master node
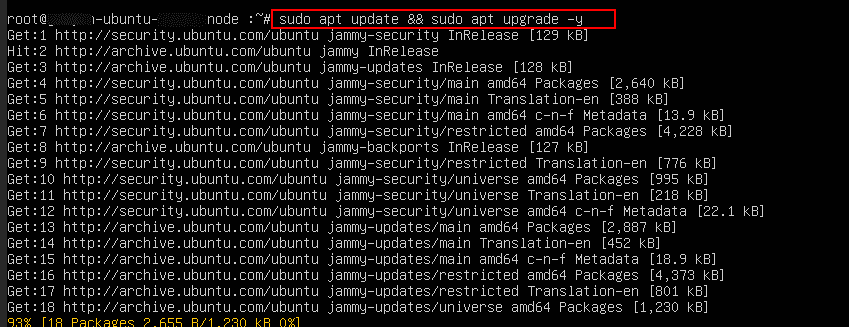
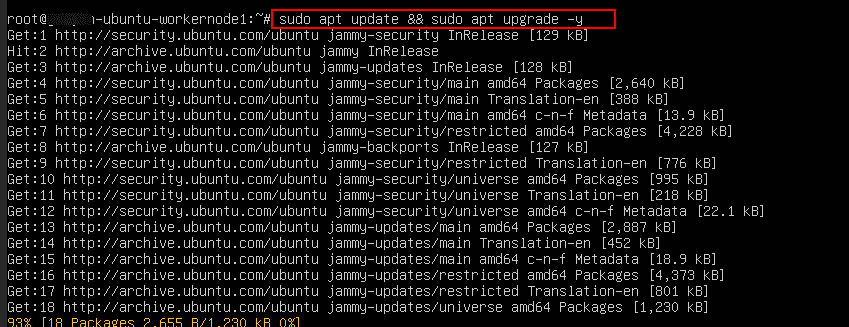
- Make sure your server is up to date by running the below command:
Command:
sudo apt update && sudo apt upgrade -y
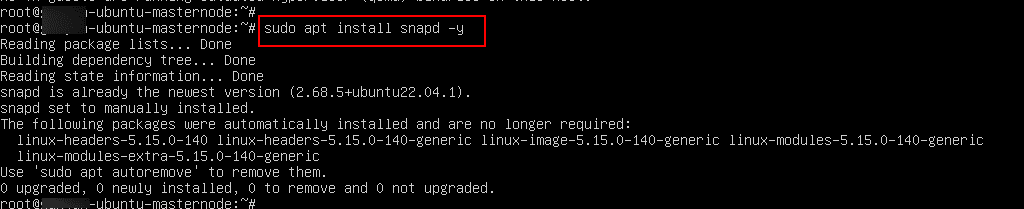
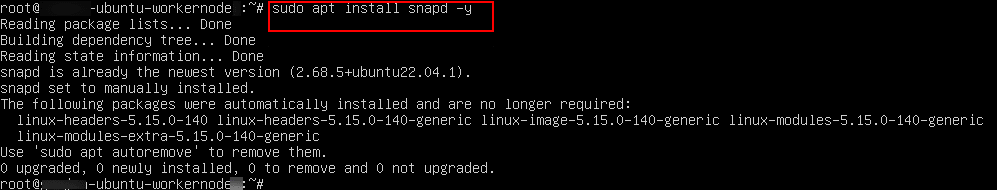
2. Install snapd by running the following command:
Command:
sudo apt install snapd -y
Note: snapd is the background service that manages and runs snaps, self-contained software packages that include all the dependencies needed to run an application. Unlike traditional package managers (like apt), snaps are easy to install, update automatically, and work consistently across different Linux distributions.
Since MicroK8s is distributed as a snap package, you’ll need snapd installed on your Ubuntu system before setting up the Kubernetes cluster.
Creating the Kubernetes cluster
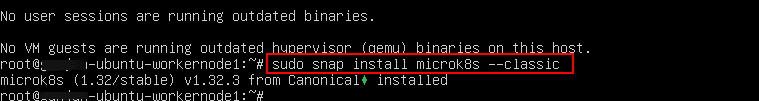
3. Install MicroK8s by running the below command on the master node:
Command:
sudo snap install microk8s --classic
You should see output like: “microk8s (1.32/stable) v1.32.3 from Canonical installed”.
![]()
4. By default, only root can run microk8s commands. To allow your user (e.g., ubuntu), run:
Command:
sudo usermod -aG microk8s $USER
sudo chown -f -R $USER ~/.kube
Note: Log out and log back in (or run newgrp microk8s) for the group change to take effect.
Command:
newgrp microk8s

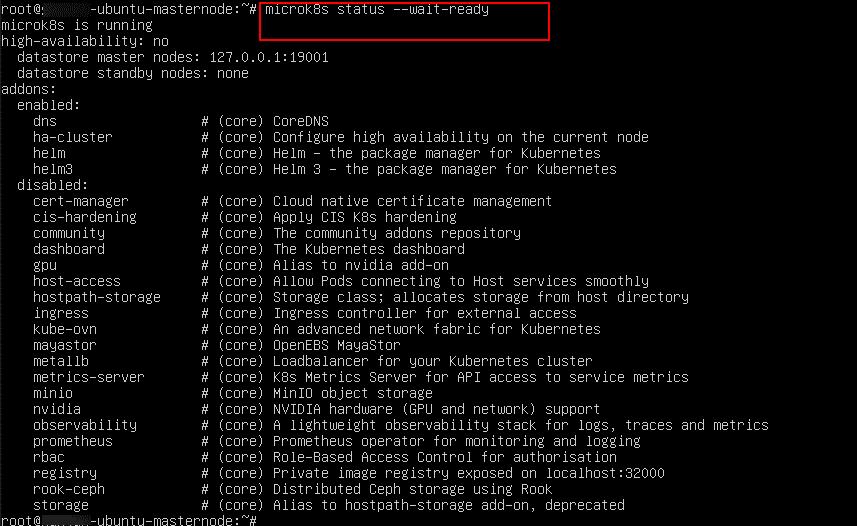
5. Check if the cluster is running:
Command:
microk8s status --wait-ready
After running the command, you should see the status of Microk8s as running as shown in the screenshot below.
Note: In this step, we created a single node Kubernetes cluster.
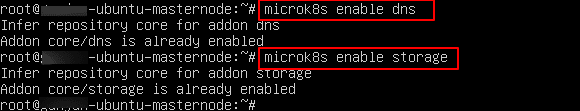
6. At minimum, enable core addons such as CoreDNS component and Storage so workloads run properly:
Command:
microk8s enable dns
Command:
microk8s enable storage
Note:
- In a MicroK8s cluster, Addons (like dns, storage, dashboard, etc.) should be enabled only on the master (control plane) node. When you enable an addon on the master, it gets deployed as Kubernetes resources (pods, deployments, services) across the cluster. The worker nodes automatically participate if the addon requires workloads to run on them (for example, dns pods may get scheduled on workers too). So, you do not need to enable addons separately on worker nodes. Just enable them once on the master node.
- To get the complete list of available addons, execute the sudo microk8s status command, and the output shows the list.
- To enable the ingress controller, you can use the following command.
Command:
sudo microk8s enable ingress
7. Now, check whether the node is registered or not by running:
Command:
microk8s kubectl get nodes
Now, the output should be as shown in the screenshot below.
NAME STATUS ROLES AGE VERSION
master-node Ready <none> 2m v1.28.3

On the Worker node:
- Now, install MicroK8s on all nodes
Command:
sudo apt update && sudo apt upgrade -y
2. Now, install snapd just as you did on the master node.
Command:
sudo apt install snapd -y
3. Then install microk8s by running the below command
Command:
sudo snap install microk8s --classic
4. Then add your user to the microk8s group (so you don’t need sudo for every command):
Command:
sudo usermod -aG microk8s $USER
sudo chown -f -R $USER ~/.kube
Note: Log out and log back in (or run newgrp microk8s) for the group change to take effect.
Command:
newgrp microk8s

Note: Repeat the same process on other worker nodes as well.
Initialize cluster on the master node:
- On the master node (the one you want as the control plane), run:
Command:
microk8s add-node
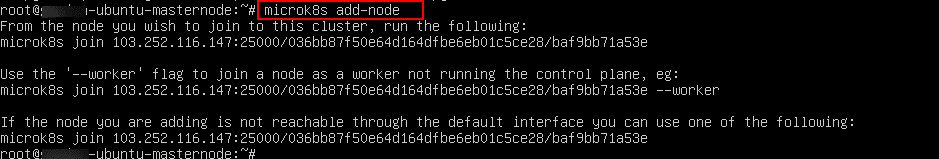
This command will generate a join command that looks like: “
microk8s join 103.252.116.147:25000/abcd1234efgh5678 --worker
- 103.252.116.147: private IP of the master node
- 25000: port used by MicroK8s for cluster joining
- Abcd1234efgh5678: unique token
Copy this output- you’ll need it on worker nodes.
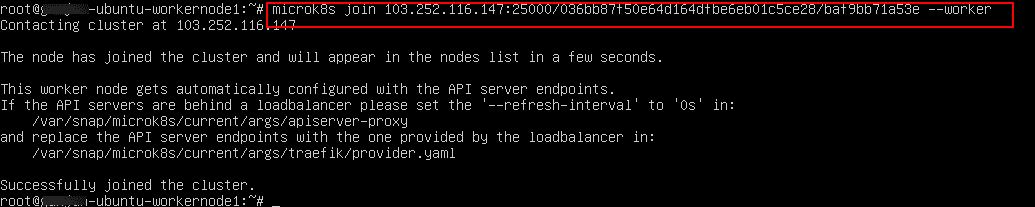
Join worker nodes:
On each worker node, run the join command provided by the master, that is:
microk8s join 103.252.116.147:25000/abcd1234efgh5678 --worker
After a few moments, the node should join the cluster, and you will see the message “Successfully joined the cluster”.
Note: Run the same command on other worker nodes as well.
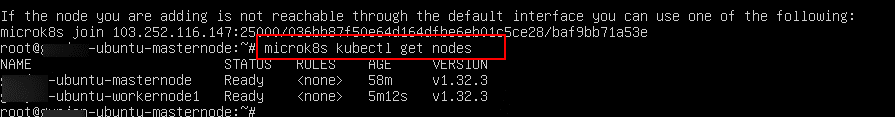
Verify cluster status:
On the master node, check that all nodes are connected:
Command:
microk8s kubectl get nodes
You should see the output as shown in the screenshot below.
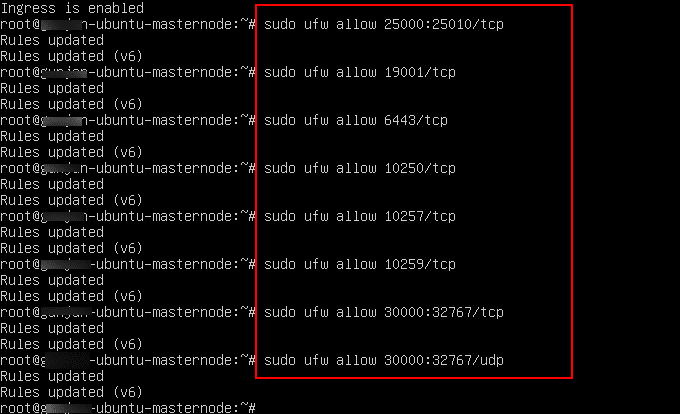
Essential ports must be allowed on all ports:
Run the commands below on the master node.
Installing the Kubernetes dashboard
- For MicroK8s cluster communication:
Command:
sudo ufw allow 25000:25010/tcp
# cluster node-to-node comms
Command:
sudo ufw allow 19001/tcp
# dqlite (MicroK8s internal DB)
Command:
sudo ufw allow 6443/tcp
# Kubernetes API server
Command:
sudo ufw allow 10250/tcp
# Kubelet API
Command:
sudo ufw allow 10257/tcp
# kube-controller-manager
Command:
sudo ufw allow 10259/tcp
# kube-scheduler
2. For NodePort services (optional, only if you plan to expose services externally via NodePort)
Command:
sudo ufw allow 30000:32767/tcp
Command:
sudo ufw allow 30000:32767/udp
Accessing the dashboard securely
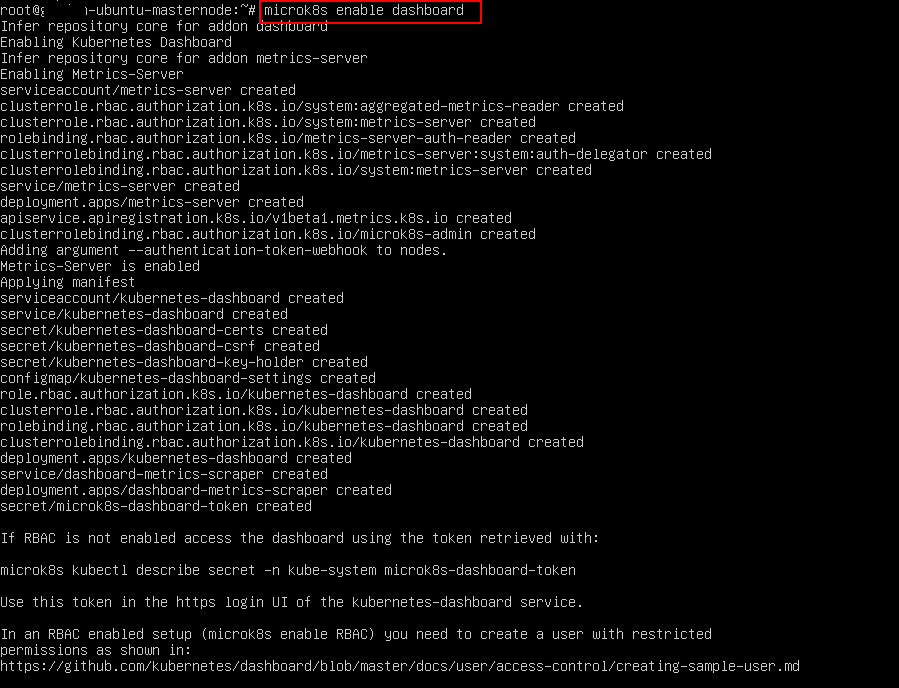
- On the master node, run:
Command:
microk8s enable dashboard
This will install the Kubernetes dashboard and the required RBAC roles and it will also expose it as a ClusterIP service inside the cluster.
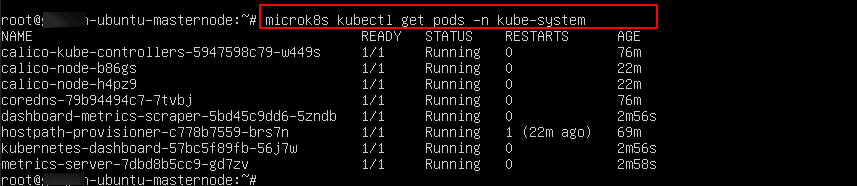
2. Verify the dashboard is running:
Command:
microk8s kubectl get pods -n kube-system
You should see something like:
kubernetes-dashboard-57bc5f89fb-56j7w 1/1 Running 0 2m56s
dashboard-metrics-scraper-5bd45c9dd6-5zndb 1/1 Running 0 2m56s
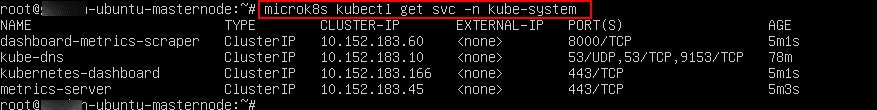
3. Now, check the service:
Command:
microk8s kubectl get svc -n kube-system
You will see:
kubernetes-dashboard ClusterIP 10.152.183.166 <none> 443/TCP 5m1s
Note: It’s a ClusterIP service (internal only).
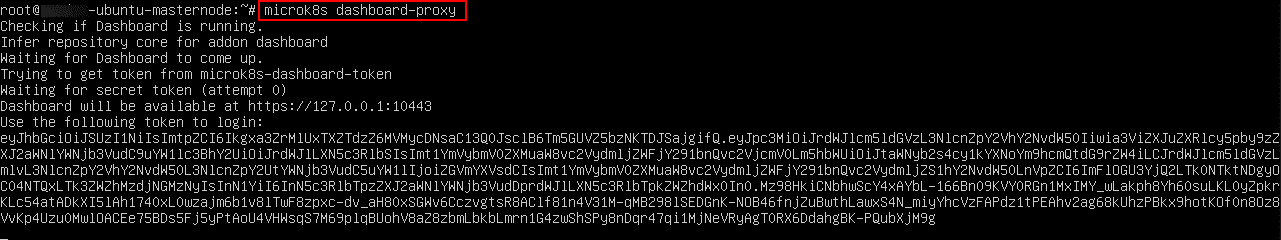
Access the dashboard (secure proxy):
Since the service is internal, use MicroK8s’ built-in proxy:
Command:
microk8s dashboard-proxy
You’ll see output like:
Dashboard will be available at https://127.0.0.1:10443
Use the following token to login
Copy this token as it is used to login to Kubernetes dashboard.
Note: This starts the Kubernetes dashboard, but it only binds to 127.0.0.1 (localhost) on the master node. That means you can only open https://127.0.0.1:10443 from the master node itself- not from your laptop/browser directly.
When you cannot open, you have 2 options to fix this
Option 1: Use SSH port forwarding (most common)
On your local machine (not the server), run:
Command:
ssh -L 10443:127.0.0.1:10443 <your-username>@<master-node-ip>
Then open in your local browser: https://127.0.0.1:10443. This way the traffic is tunneled securely to the cluster.
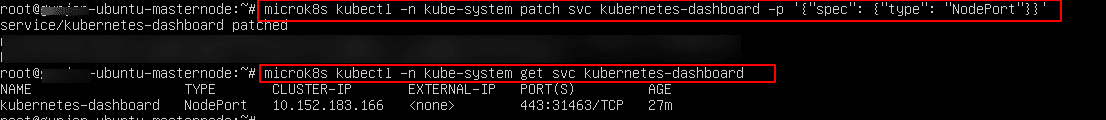
Option 2: Expose the dashboard with NodePort (direct browser access):
Command:
microk8s kubectl -n kube-system patch svc kubernetes-dashboard -p '{"spec": {"type": "NodePort"}}'
Then get the NodePort:
Command:
microk8s kubectl -n kube-system get svc kubernetes-dashboard
You will see the output:
kubernetes-dashboard NodePort 10.152.183.166 <none> 443:31463/TCP
Now, try to open the link your_master_node_ip:31463 in the new tab, click on Advanced.
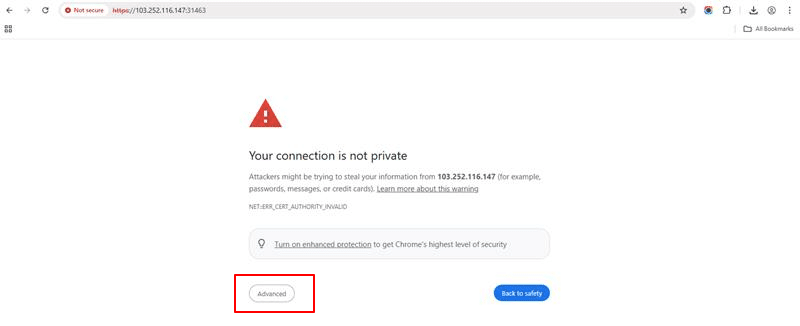
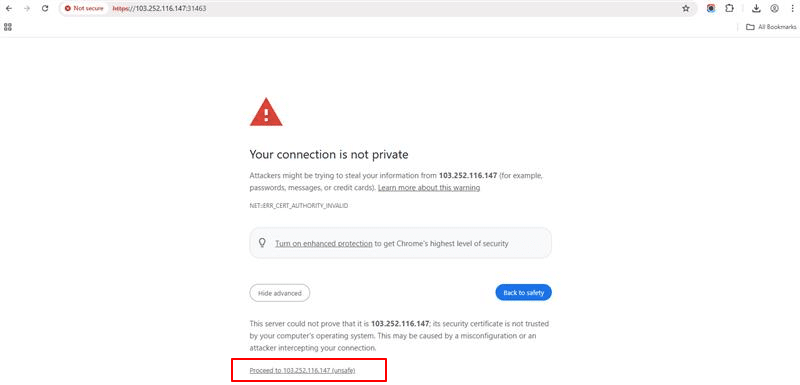
Click on Proceed to xxx.xxx.xxx.xxx:31463.
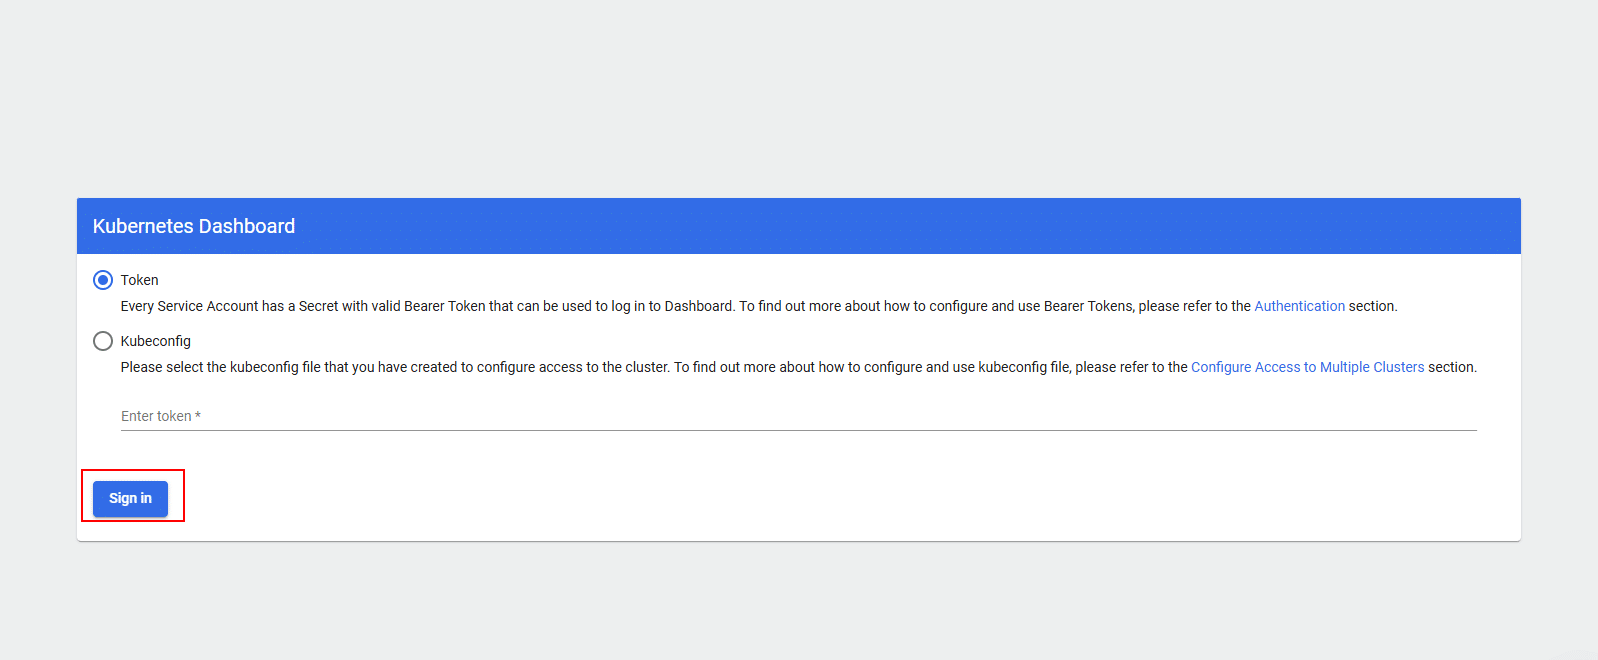
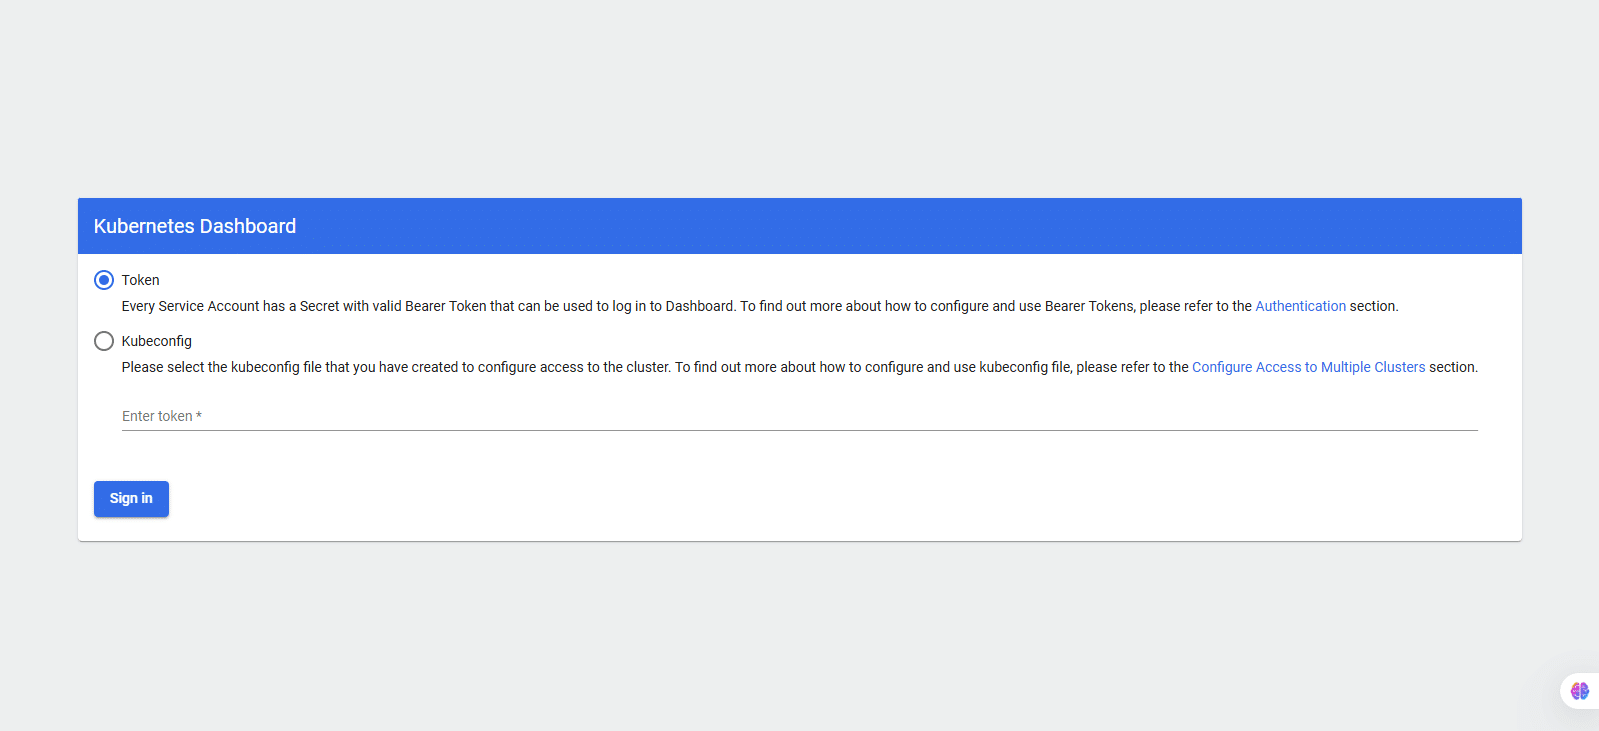
Now, log in using the token you retrieved earlier with the Command:
microk8s dashboard-proxy
After entering the token, click Sign in.
Troubleshooting authentication issues
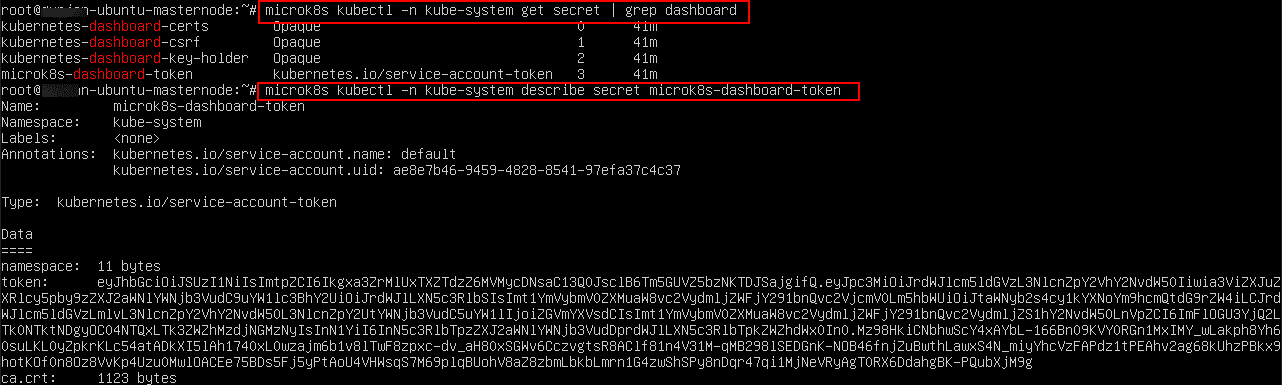
If, after entering the token and clicking Sign in, you see the message: ‘Unauthorized (401): Invalid credentials provided’, it usually means the wrong token was used (for example, from a secret not linked to the Dashboard ServiceAccount). To fix this, run the following command on the master node:
Command:
microk8s kubectl -n kube-system get secret | grep dashboard
Then, you will see output similar to the following:
- kubernetes-dashboard-certs
- kubernetes-dashboard-csrf
- kubernetes-dashboard-key-holder
- kubernetes-dashboard-token
The one you need is the secret that ends with -token.
To describe this token secret, run:
Command:
microk8s kubectl -n kube-system describe secret kubernetes-dashboard-token
Copy the long JWT value shown under token:
Now, go back to your dashboard login page and paste the token. This should log you in successfully.
If you still see the message “Unauthorized (401): Invalid credentials provided”, it may be because the Dashboard ServiceAccount does not have sufficient permissions.
In that case, create an admin account as follows:
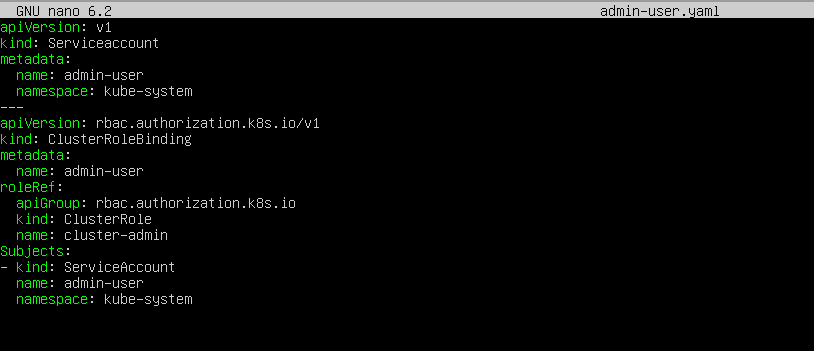
On your master node, open a new file:
Command:
sudo nano admin-user.yaml
Copy the entire script below and paste it into the admin-user.yaml file you just created, as shown in the screenshot.
apiVersion: v1

kind: ServiceAccount

metadata:

  name: admin-user

  namespace: kube-system

---

apiVersion: rbac.authorization.k8s.io/v1

kind: ClusterRoleBinding

metadata:

  name: admin-user

roleRef:

  apiGroup: rbac.authorization.k8s.io

  kind: ClusterRole

  name: cluster-admin

subjects:

- kind: ServiceAccount

  name: admin-user

  namespace: kube-system
Now, save and exit the file by pressing CTRL+O, then Enter, and finally CTRL+X.
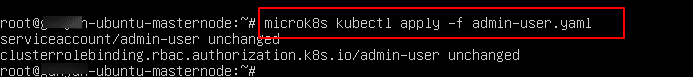
Apply it by running the following command:
Command:
microk8s kubectl apply -f admin-user.yaml
This will create the admin user with cluster-admin privileges.
You should see output similar to:
Serviceaccount/admin-user unchanged
Clusterrolebinding.rbac.authorization.k8s.io/admin-user unchanged
This output means your admin-user ServiceAccount and ClusterRoleBinding are now correctly applied.
Now, get the login token for the Kubernetes dashboard by running:
Command:
microk8s kubectl -n kube-system create token admin-user
This will generate and display a long JWT token string. Copy this token for use on the dashboard login page.
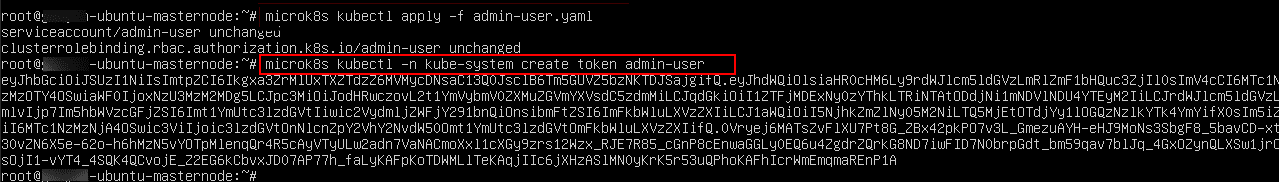
Paste the copied token into the Kubernetes dashboard login screen and click Sign in.
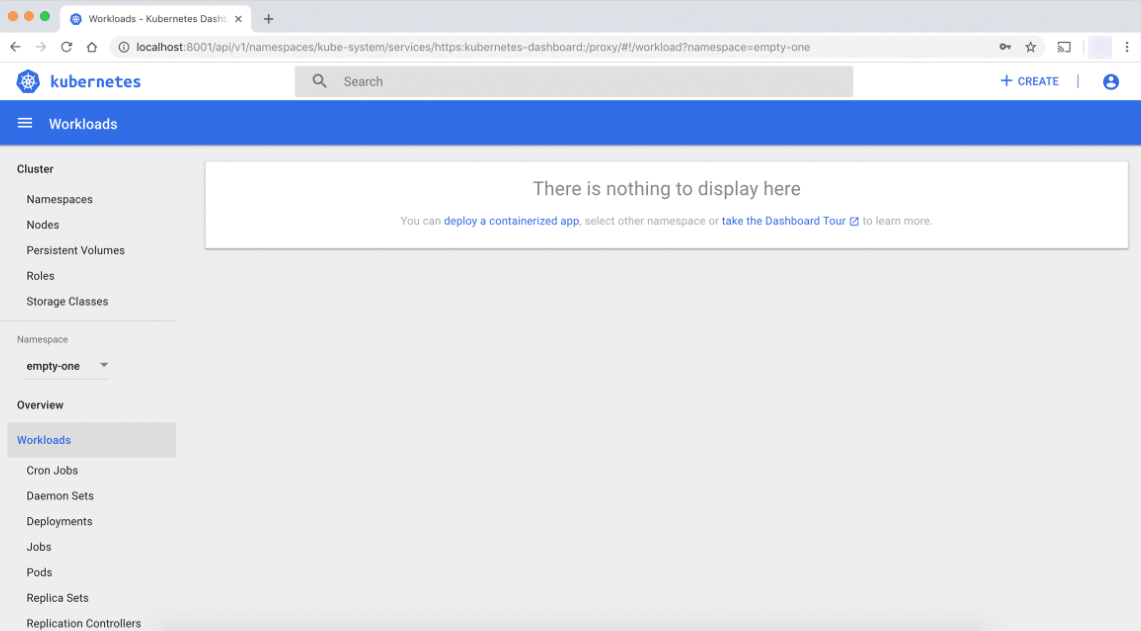
Managing your cluster through the dashboard
Now, you are in Kubernetes dashboard. From here, you can:
- Monitor cluster health: view nodes, namespaces, workloads, and resource usage.
- Manage workloads: create, update, or delete Deployments, Pods, and ReplicaSets.
- Check services and networking: inspect Services, Ingress, and Endpoints.
- View and manage ConfigMaps & Secrets: securely handle application configurations.
- Manage RBAC and users: view Roles, RoleBindings, and ServiceAccounts.
- Troubleshoot: review logs, check events, and debug running Pods.
And that’s it! You have successfully learned how to install the Kubernetes dashboard.